- Research
- Open access
- Published:
Systematic dynamic assessment for resilient operation of distribution networks
Energy Informatics volume 1, Article number: 24 (2018)
Abstract
The integration of decentralized energy resources is changing the ways distribution grids are being operated. Moreover, a major change is the implementation of active control strategies to adapt to the energy transition, such as voltage and reactive power in-feed control. Correspondingly, the dynamic nature of these controllers, the potential conflict of control objectives and uncertainty of these sources require frequent assessment of the system’s dynamic behaviour. For this reason, this paper defines high level guidelines that allow simplifying Dynamic Security Assessment (DSA) in distribution networks, through the implementation of a methodology to determine the interactions of the network with its controllers. With this in mind, the focus of these guidelines is kept in reducing the computational effort, by reducing the number of dynamic simulations, as well as the amount of active controllers necessary for DSA. These guidelines are verified in an artificial 242-busbar distribution network, resulting in a reduction of 21,4% in number of dynamic simulations required for DSA.
Introduction
The current evolution of power systems from an unidirectional to a multi-directional power flow system, in which decentralized generation sources are increasing, impacts directly the way they are being operated to ensure the security and quality of electrical supply (Jakus et al. 2015; Velasquez et al. 2018). The intermittent nature of the renewable energy sources, in addition to their massive decentralized installation in distribution networks, pushes the implementation of different controller strategies to optimally manage the network, which require the joint participation of a large set of controllable elements (VDE (FNN) 2016). Moreover, this management is accompanied by the introduction of a more complex information and communication technologies (ICT), as decentralized controllers act together based on the information exchange between them and remote substations in the power grid, turning the conventional power system into a digitalized one (Mayer et al. 2018).
In such a digitalized system, dynamic behavior is now not only influenced by the conventional centralized local controllers, but also by the high amount of decentralized controllers and their respective ICT infrastructure. The numerous amount of controllers in the system, in addition to the numerous amount of control schemes they can adopt and the inherent vulnerabilities of ICT systems (Otuoze et al. 2018), may yield unforeseen unwanted and unprecedented dynamic behavior that could impact the power system security (Velasquez et al. 2018). Therefore, dynamic behavior analyses must be able to include these new factors.
Important to realize is that the high amount of controllable elements requires the adaptation of tools which allows forecasting the dynamic behavior of the system in real time operation to perform a successful DSA. However, the high computational effort required to perform such real-time analyses poses a challenge in the implementation of such a tool. On the transmission system level, DSA has been addressed in numerous projects and studies (Panciatici et al. 2014; Morison and Glavic 2007) that tackle these computational issues, finding a trade-off between computation speed, accuracy and flexibility, with the objective of approaching an on-line, real-time security assessment. These efforts have proved successful with existing implementation of DSA applications in power systems in China, The United States, Japan, Brazil, Canada and New Zealand (Sun et al. 2016).
However, the wide study of DSA in conventional power systems does not consider possible ICT related issues in digitalized distribution networks. In this sense, this paper fills the literature gap of DSA in these networks while facing events (both from the power system and its ICT infrastructure), or for determining its optimal dynamic operation. Indeed, the number of active actors in the network creates a playground for large scale unintended (i.e. failures) or intended (i.e. cyber-attacks) disturbances, resulting in probabilistic security risks that require fast and effective assessment tools (Ciapessoni et al. 2017).
The main contribution of this paper is the proposal of general guidelines to reduce the number of simulations and controllers it includes in them, with the aim of simplifying on-line DSA. As a sub-contribution, this paper presents a methodology to map the controllers inputs and outputs according to the power system variables. The paper is organized as follows: Firstly, the background and the problem statement is discussed, in which cyber-physical systems are presented and the necessity for DSA in these systems is addressed. Secondly, the simplification guidelines for DSA in distribution networks with high presence of controllable elements are presented. Thirdly, the proof of concept of these guidelines in an artificial 242-busbar distribution network is executed. Finally, the discussion and conclusions are presented, which focus on the efficacy and efficiency of these guidelines.
Background and problem statement
Cyber-Resilience: paradigm change in security assessment of a power system
Robustness and Resiliency are two key attributes of a power system to guarantee its secure and uninterrupted operation. The first relates to its capability to face disturbances without leading to a loss of demand (Arghandeh et al. 2016), while the second relates to its ability to quickly absorb and recover from large and non-predictable disturbances (Bie et al. 2017). Conventionally, these attributes are addressed by adding redundancy to the system’s infrastructure (e.g. N-1 criterion) and designing defense plans for extreme contingencies, which are usually prior identified through off-line power system analyses.
The current development of renewable energies employed in the distribution networks, in addition to the change of the consumers’ behavior, reduces the certainty of demand estimation thus increasing its operation complexity. Under this evolution, continuous and reliable information flow becomes critical in foreseeing the operation state of the power system and its degree of security. In this sense, the development of the innovation in ICT (e.g. artificial intelligence, the Internet of things, cloud technologies) brings a further digitalization of the distribution networks, where small producers connected in the low voltage levels gain prominence in the energy system (Mayer et al. 2018). Based on the latter, the power system is evolving towards a digitalized system in which ICT is one more of its components, instead of a separate layer (Babazadeh and Nordström 2014).
Although the ICT employment and its development is crucial to increase awareness of a power system operation state, it is not exempt from vulnerabilities that could jeopardize its security (Mayer et al. 2018). Therefore, the digitalization of the power system is accompanied by ICT related threats and risks that could lead to a power system failure, such as software errors, communication impairments, and even malicious intentional cyber-attacks. As a context example, a hacker attack has been presumably responsible for Ukraine’s 2015 blackout (Lee et al. 2016). These vulnerabilities extend to the elements, which employ this infrastructure, such as control schemes which require the joint action of decentralized controllers. Therefore, control schemes are susceptible to encounter ICT related issues (Pan et al. 2017).
Given this transformation, the concept of resilience in a cyber-physical system is extended considering the inclusion of ICT components, namely referred as “cyber-resilience” (Mayer et al. 2018). Consequently, a system is denoted as “cyber-resilient” if the ICT components and the ICT-based processes associated with the energy-related components increase the resilience of the overall system (Fig. 1).

Cyber-resilience concept in cyber-physical systems. Link of security attributes of physical systems and digitalization trends in the cyber-resilience definition
One of this possibilities includes using the advanced computer simulation to analysis the behaviour of the network as close as possible to real-time and predict the impact of potential failures or system configurations on the system performance. To this end, this paper presents a framework to model the interaction of control schemes deployed in ICT-reliant distribution grids and suggest a set of guidelines to delimit the evaluation space design, which helps the assessment to be more efficient.
Role of DSA in cyber-physical systems
In order to apply this analysis to cyber-physical systems, DSA needs to be able to consider both disturbances in the power system and communication-related disturbances, such as the impairments of the ICT devices and malicious attacks (Fig. 2). In case of power system disturbances, DSA should be able to deterministically identify whether a possible contingency might result in violations of the electrical variables of a power system (e.g. non-grid code compliance, such as under or over-voltages result in violations), based on results of time-domain simulations of the power system (referred as dynamic simulations in terms of this paper). In case of ICT-related disturbances and its stochastic nature, DSA should be able to determine the grid-code compliance degree of the power system, based on multiple results of the co-simulation of power system and ICT dynamics. Specifically, a cyber-resilient system should be able to (Mayer et al. 2018):
-
Create a precise picture of the operational state of a power system.
Fig. 2 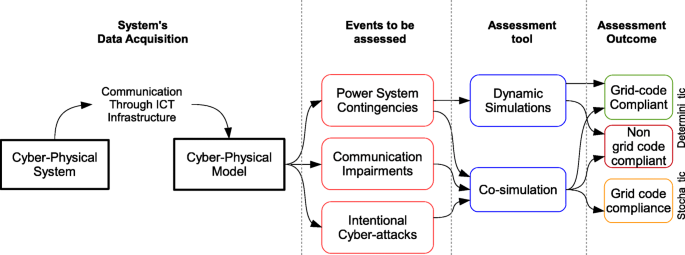
DSA scheme in cyber-physical systems. Process flow of DSA in digitalized distribution networks
-
Predict the impact of corrective measures to restore a system under failure.
-
Estimate the extent of the risk for frequent disturbances.
-
Extend the resilience of the system under cyber-disturbances.

The first point is accomplished by the employment of precise and reliable communication devices throughout the power system that allow visualizing its current state in real time. Points 2, 3 and 4 are achieved by performing simulations of a set of plausible disturbances (both in the power system as well as in the ICT infrastructure) for the current state of the network, which provides a metric on its security degree. This process is also referred to as DSA, whose main obstacle is the high computational effort needed to consider every component, variable, and event that could take place in this more complex cyber-physical system. Figure 2 depicts a high-level diagram of the dynamic security assessment of a cyber-physical system.
Although DSA has been widely discussed for the power transmission level, this is not the case for the distribution systems, which have historically been considered and designed as passive networks. The integration of decentralized energy resources is taking a more prominent role supporting energy transition, with more autonomous and proactive distribution networks. This means here that the distribution system operators have to face unprecedented challenges such as the interaction of new control strategies designed to enable the seamless adoption of renewable energy resources into the grid (Nijhuis et al. 2015), thus maintaining service security and quality. In addition, there have been multiple efforts towards understanding the overall impacts of the integration of renewable source-based decentralized generation units on distribution networks (Nijhuis et al. 2015), including the effects that brings the implementation of new active control strategies. Indeed, one of the approaches to mitigate the effects of massive renewable decentralized generation has been to count with an Active Network Management (Mahmud and Zahedi 2016), a centralized strategy that allows the operator to maximize in real-time the use of the existing electrical infrastructure to control key quality electrical variables, such as voltage magnitude and reactive power management. This new approach involves the use of control systems which react according to the dynamic evolution of the system, thus the analysis of their interactions require a time-domain simulation of the network.
Based on the above, the adoption of active control strategies on distribution networks, added to the massive interconnection of potentially-controllable renewable distributed generation, creates the need to implement real-time DSA to distribution networks. Subsequently, such a tool can play a major role monitoring and controlling in real-time the status of the distribution system. Specifically, it can indicate the operator the expected consequences of their actions and commands, taking into account the effect of the controllers installed throughout the network. Unlike in transmission systems, it allows facing the massive ICT integration of active components (i.e. sensors, actuators) which have a major role in the system security for distribution networks.
Given the mathematical and computational complexity of implementing DSA in active distribution network with adopting active network management, the contribution of this paper is the definition of general guidelines to simplify its application by reducing the number of dynamic simulations, as well as the active controllers required in them, to obtain a thorough view of the distribution system security status.
These simplification guidelines are obtained by defining general rules that allow discarding the execution of specific dynamic simulations based on the general characteristics of controllers, such as their inputs, outputs and control philosophy.
General guidelines to simplify DSA in cyber-physical systems
This section describes the simplification guidelines defined to reduce the number of dynamic simulations of the distribution network and the number of active controllers in each one of them, with the aim to simplify DSA, according to the diagram shown in Fig. 3.

Controller combination/event matrix with simplified DSA criteria. Description of simplification of DSA via reduction of number of active controllers and amount of simulations
The assumptions considered for the creation of these guidelines are:
-
There is a high presence of controllable elements in the distribution network.
-
The controllers are considered to be described according to the specifications given in standard IEC61499 (Andr et al. 2014).
-
The controllers of these elements have several independent control strategies, which can be set by a centralized agent.
-
DSA is performed based on possible events that can take place in the power system, as well as in the controllable elements.
A complete DSA is performed by executing time domain simulations for each pre-defined event, considering all possible control strategies for each group of controllable elements. The simplification guidelines would allow identifying beforehand which simulations do not impact the security of supply. On the other hand, for each simulation, it would allow identifying controllers whose interaction with the power system and the rest of the controllers are not significant for the simulation in terms of security of supply.
These guidelines are divided in three parts:
-
1
The first task is to map the inputs, outputs and influence of the controllers present in a power system, against the electrical power system variables, denoted as “Controller Influence Chart”.
-
2
Using the previously defined chart as input, the guidelines for reducing amount of active controllers in the dynamic simulations are defined
-
3
Finally, with the Controller Influence Chart as input, and using the guidelines described in point 2, the complete guidelines for reducing the amount of dynamic simulations is created
These stages are described in the following subsections.
Mapping of the influence of controllers onto the distribution network
Figure 4 shows a high level methodology for understanding the possible influences that a controller could exert on other controllers and the power system, based on their inputs, outputs and objectives. The desired outcome is create a chart, which summarizes the controllers influence upon different network variables, denoted as Controller Influence Chart (CIC).

Controller Influence chart (CIC). Methodology to identify the influence of each controller upon the others and the system
The methodology for creating the CIC is composed by two sequential blocks: ‘Elements Identification’ and ‘Elements Processing’.
The ‘Elements Identification’ block is the first step for determining the influences of a controller upon the others. This step consists in analyzing the topological characteristics of the distribution network and the general characteristic of the controllers (inputs, outputs and objectives).
With this information, the second step of the methodology, ‘Elements Processing’, may be executed. This block allows completing the CIC, and it is classified in a set of four steps:
-
Step 1 – Controller grouping with similar objectives: By having identified the controllers’ objectives, this step allows filling the first two columns of the CIC. The first column is filled with the identified main objectives of the controllers, and the second with the controllers that follow each objective.
-
Step 2 – Inputs/Outputs in each controller: Having identified the Inputs and Outputs of each controller in the first block ’Elements Identification’, it is possible to fill out the table by placing flags in the corresponding variables. At this point, the number of inputs and outputs found for each variable may be counted and registered at the final two rows of the CIC. This allows having a general view of the number of times each variable is being called by the different controllers:
-
◇For the inputs: The number of controllers that are requiring the information of a particular variable.
-
◇For the outputs: The number of controllers that are controlling a particular variable
-
-
Step 3 – For each controller, identify influence on each electrical variable: This step requires an understanding of general power system behavior and the controller’s main objectives. This step allows registering the influence zone of a controller within all the electrical variables listed in the first row.
-
Step 4 – Remove columns of variables which are not Inputs/outputs or not affected: This step simplifies the CIC, removing all the variables which are not affected by the controllers included in the table.
The result of following the before-mentioned procedure is the CIC, which gives an overview of the different objectives of a group of controllers and the variables they affect, as shown in Fig. 5.

CIC Example Information given by a Controller Influence Chart
Indeed, useful information can be withdrawn from this table:
-
Quick Summary of Controllers and Objectives: The CIC is designed in a way that the identification of the controllers who serve to a same particular purpose may be directly visualized.
-
Identification of Critical Variables: The CIC permits quickly visualizing the number of times for which a variable is input or output of a group of controllers. In this sense, the number of inputs is relevant because this means that the correct and successful communication of a particular variable’s value is essential for the controllers which are using it as input. This is to say, the higher this number, the more controllers rely on the value of this variable. On the other hand, the number of outputs is relevant because it shows how many controllers are controlling a particular variable. If the number is greater than ‘1’, it means that different controllers are simultaneously controlling the value of this variable.
-
Identification of Influence Zones: The red colored cells of the CIC represent the variables that are being affected product of a controller action. This cell allows distinguishing the reach of a controller or a group of controllers on the distribution network.
Based on the above, the CIC is the starting point in the definition of guidelines for DSA simplification
Guidelines for reducing the amount of dynamic simulations required for DSA
The second step of the guidelines consists in a heuristic routine designed to identify which controllers are not significant for the simulation in terms of security of supply, in order to discard the dynamic behavior of such controllers, thus reducing the computational effort needed to carry these simulations.
On one hand, Fig. 6 shows the DSA simplification guideline that allows reducing the number of active controllers modeled in a dynamic simulation. In order to achieve this, the CIC is required as input.

DSA simplification guidelines. Reduction of controllers in simulations
The main idea behind this guideline is to determine for each controller the elements in the distribution network that are affected by its action. Once the influence zone is identified for each controller, the next step is to determine whether the influence zone of each controller is important for DSA assessment. The importance of a controller is defined taking into account the following criteria:
-
If the influence of a controller upon the distribution network does not propagate beyond the low voltage level, this controller is undermined if it does not affect other variables that are inputs or outputs of other controllers.
-
If the influence of a controller does not propagate beyond a radial MV-feeder, this controller is undermined if it does not affect other variables that are inputs or outputs of other controllers located outside the radial MV-feeder.
Finally, if the influenced zone is important for DSA, the corresponding controllers are modelled and activated in the simulation. Otherwise, the corresponding controllers are undermined for the dynamic simulation.
Guidelines for reducing the amount of active controllers in dynamic simulations required for DSA
At this point, the influence of the controllers upon the system and themselves is mapped through the CIC, and a routine for reducing the number of active controllers in the dynamic simulations has been determined. With these elements, Fig. 7 shows the Complete DSA simplification guideline, which also allows reducing the number of dynamic simulations needed to perform a successful DSA. The inputs required to achieve this are:
-
The list of controller combinations that can be set in the active elements of a distribution network.
Fig. 7 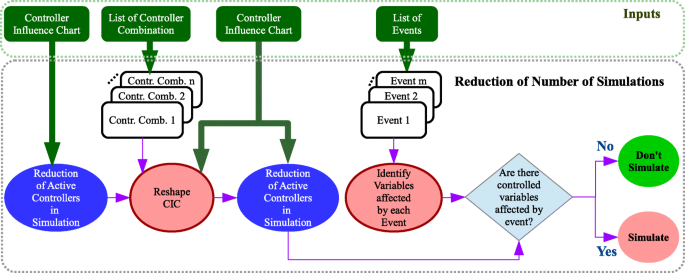
DSA simplification guidelines. Reduction of number of simulations
-
The Controller Influence Chart.
-
The list of pre-defined events of interest for the execution of a DSA.

The main idea behind this guideline is to determine whether a given controller combination, for a given event, poses threats to the security of the distribution system. If so, the simulation is executed, and otherwise it is discarded from Dynamic Security Assessment, thus reducing the computational effort.
Figure 7 shows the complete DSA simplification guidelines, in which the number of dynamic simulations needed for DSA is reduced. In this methodology, the guidelines for reduction of controller in simulations are applied twice as a subroutine.
The step-by-step explanation of the guidelines expressed in Fig. 7 is presented:
-
1
The subroutine for the Reduction of Active Controllers in Simulation is applied, using the CIC as input, with the aim of identifying the active controllers that may be initially neglected in the dynamic simulations.
-
2
For each controller combination, the CIC is reshaped, by deleting the rows of those controllers, which are not considered in the respective controller combination.
-
3
The subroutine for the Reduction of Active Controllers in Simulation guideline is applied again, using the reshaped CIC as input, with the aim of further identifying the active controllers that may be neglected in the dynamic simulations for a certain controller combination.
-
4
For each event, the variables that are influenced are identified via a load flow analysis. Because of this, the dynamic behavior of the controllers is not present in this static load-flow, and therefore the variables affected by the event are independent from the active controllers of the distribution network.
-
5
The variables affected by the event are compared against the reshaped CIC. Furthermore, it is determined whether there are variables affected by events which are input or output of controllers. This step excludes the controllers, which are undermined in the “reduction of active controller in simulations”, and therefore, they are also deleted from the CIC.
-
6
If the variables, which are affected by an event are inputs or outputs of controllers, then the simulation is executed and taken into account for DSA. Otherwise, the simulation is undermined, thus reducing the computational effort of a complete DSA.
Verification study case
In this section, the DSA simplification guidelines are applied in an artificial distribution network which consists of active, controllable elements. The elements of the artificial network and its controllers are modeled in the software PowerFactory 2017 Service Pack 2, offered by DIgSILENT®;. This software package allows performing digital simulations and network calculations of a power system. Additionally, its tools allow modelling controllers through block diagrams, using the “DIgSILENT Simulation Language”.
Figure 8 shows the sequential methodology for the verification of the DSA simplification guidelines:

Verification of DSA simplification guidelines. Flow process to assess effectivity and efficacy of the guidelines
These sequential steps are described as followed:
-
1
Creation of Synthetic Distribution System: the first step to verify the DSA simplification guidelines is to create with a Distribution System with active elements. In this case, a distribution system with high penetration levels of renewable decentralized generation units is employed. The main goals of this step are to define the topology of the distribution system and the parameters of its elements.
-
2
Definition of Active Controllers in the Distribution System: once the Distribution System is defined, the next step is to define the controllers present in each of the elements, and model them in the DIgSILENT Simulation Language. Various controllers may be defined for the same element, and therefore this step also considers the definition of possible controller combinations.
-
3
Analysis of Contingencies of Distribution System: the third step is to identify the critical events in the distribution network via load flow calculation analyses. Then, the impact of each event upon the distribution network is assessed, which helps defining the list of pre-defined events for DSA assessment.
-
4
Building of Controller Influence Chart: this step consists of creating the Controller Influence Chart based on the characteristics of the Synthetic distribution Network and its controllers.
-
5
Application of DSA Simplification Guidelines: this step consists of applying the DSA simplification guidelines in order to determine which controllers and simulations are undermined based on the CIC, the list of pre-defined events, and the list of controller combinations.
-
6
Simulation of each Event for each Controller Combination: in order to assess the DSA simplification guidelines, it is required to simulate every event for every controller combination. This is to say, a complete non-simplified DSA assessment is needed to identify the optimal simplification of DSA. It is noted that the dynamic simulations correspond to electromechanical simulations of the distribution network within the domain of time.
-
7
Comparison of Simulations with Results of DSA Guidelines: finally, the results obtained with the employment of the DSA simplification guidelines are compared to the results obtained via dynamic simulations. This allows determining whether the design of the guidelines permits to foresee if the dynamic behavior of some controllers and some simulations may be undermined.
Synthetic distribution network
The synthetic distribution network is designed so it may be analyzed independently from the dynamic behaviour that may occur in the transmission network. Because of that, the synthetic network has one HV infinite busbar, this is to say, a busbar which may absorb or inject the required active and reactive power in order to maintain the defined active power load and losses, and the voltage set-point of the HV busbar, respectively.
Figure 9 shows the representation of the synthetic distribution network modeled in PowerFactory 2017 SP2, in which all the elements are shown and colored according to the voltage level on which they operate.

One-Line Diagram of the synthetic distribution network. 242-busbar synthetic distribution network containing controllable elements
Specifically, the following voltage levels are defined:
High Voltage (HV) level – 110kV: this voltage level is the representation of the busbar from the transmission system, which is connected to the distribution network. Certainly, this busbar is connected to one of the MV busbars through a HV/MV transformer, and an External Grid element, which represents the rest of the transmission network.
Medium Voltage (MV) level – 23kV: As shown in Fig. 9, the busbars of this voltage level are connected though power cables, which define the topology of the distribution network. Additionally, this voltage level counts with medium-scale wind farms (WF), which are located throughout the distribution network.
Low Voltage (LV) level – 0,4kV: The final consumers are located in this voltage level. Each MV busbar counts with a MV/LV transformer which allows feeding the final consumers, represented by a load. Additionally, a Photovoltaic (PV) system is modeled in each of these busbars, which represent the generation units present at consumer level (i.e. rooftop PV systems).
It can be noted that the topology of the system covers two different kinds of structures. On one hand, there is a section of the network which is meshed, represented by the busbars located around the busbars MV-BB001, MV-BB009, MV-BB019, MV-BB022, MV-BB029, MV-BB047, MV-BB056 and MV-BB069. On the other hand, one radial feeder is defined, represented by the busbars located between MV-BB095 and MV-BB121 busbars.
The idea behind the construction of the topology of the synthetic distribution network is to connect a group of “PV-Load blocks” (see Fig. 10) in order to create a feeder, which are then assembled to define the topology of the network. To simplify this process, each “PV-Load Block” of the synthetic network possesses the same electrical properties. The characteristics of each of the elements of the “PV-Load Block” are given in Table 1.

PV-Load Block. Elements used to define feeders in the synthetic distribution network
The synthetic distribution network has a total of 15 feeders, which contain in total 120 “PV-Load Blocks”. These feeders are described in Table 2.
The rest of the elements present in the distribution network are the medium-scale wind farms, the shunt reactor, the HV/MV and MV/MV Transformers, and the External grid. The parameters of these elements are shown in Table 3.
List of possible controller combination
The elements of the synthetic distribution network are equipped with controllers which can be configured with different control philosophies. In particular, the following controllers are employed:
-
Photovoltaic solar panels:
-
◇ Controller cos ϕ(P): controller that sets the reactive power setpoint of the source to maintain its power factor, which is determined based on the active power injected by the source according to the curve presented in Fig. 11a (im VDN(FNN) 2014).
Fig. 11 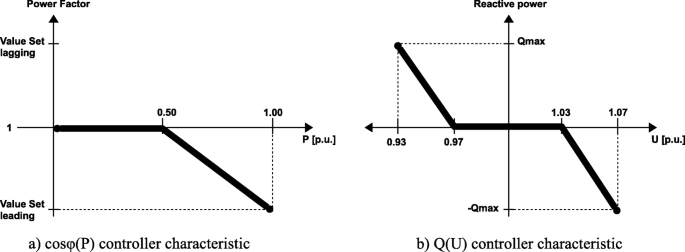
Standard control tasks for renewable DG unit. a cos ϕ(P)characteristic. b Q(U)-characteristic. Based on (im VDN(FNN) 2014)
-
◇ Controller Q(U): controller that sets the reactive power setpoint of the source based on the voltage measured in its terminal, according to the curve presented in Fig. 11b (im VDN(FNN) 2014).
-
-
Wind farms:
-
◇ Controller cos ϕ(P).
-
◇ Controller Q(U).
-
◇ Controller Q(Q): controller that sets the reactive power setpoint of the source based on the reactive power measured remotely at the HV/MV transformer, to maintain its reactive power in-feed constant.
-
-
Shunt reactor:
-
◇ Controller Q(Q): controller that sets the step of the reactor based on the reactive power measured remotely at the HV/MV transformer, to maintain its reactive power in-feed constant.
-
-
Transformer HV/MV
-
◇ Power-dependent voltage set point Tap changer controller: controller that adjusts the tap of the transformer in order to maintain the voltage module within a pre-defined voltage range, defined by a voltage setpoint which is dependent of its active power flow according to the curve presented in Fig. 12 (VDE (FNN) 2016).
Fig. 12 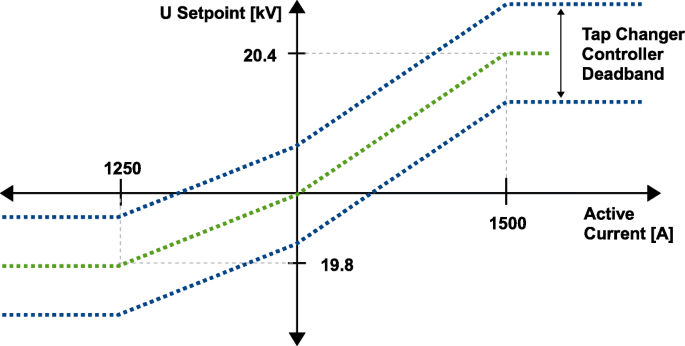
Dynamic voltage setpoint characteristic of a HV/MV transformer. Active power dependency of voltage setpoint in a HV/MV transformer. Based on (VDE (FNN) 2016)
-
-
Transformers MV/MV and MV/LV
-
◇ Constant voltage set point Tap changer controller: controller that adjusts the tap of the transformer in order to maintain the voltage module within a pre-defined voltage range, defined by a constant voltage setpoint of 1,0 p.u.
-


With these controllers, it is possible to construct one of the inputs required for the DSA simplification guidelines. Table 4 shows the list of controller combination for the DSA simplification guidelines. The first row shows the Scenario number (S01, S02, etc), and each of these columns show which of the controllers are active (marked with an “A”) and inactive (empty cell).
Predefined events
According to the characteristics of the synthetic distribution network, four events are chosen to test the DSA simplification guidelines: a topology change event (through the operation of the switches of the distribution network), a voltage event, an active power event caused by the PV sources, and an active power event caused by the wind farms. The characteristics of these events are shown in Table 5.
Results of the guidelines
This section makes a comparison between the results obtained through the DSA simplification guidelines and the results obtained through the execution of dynamic simulations.
Table 6 shows the overall comparison of the DSA simplification guidelines. The analysis carried out through “DSA simplification guidelines” show that a total of 6 simulations may be discarded, and a total of 121 controllers may be discarded in 18 out of the 42 remaining simulations. In comparison, the analysis through “Execution of dynamic Simulations” is done by examining all 48 dynamic simulations and discarding the simulations and controllers which do not influence the security of the system. This shows that a total of 28 simulations may be discarded, and a total of 121 controllers may be discarded in the rest of the 20 remaining simulations.
In terms of “Reduction of Active Controllers in Simulation”, the simulations show that the controllers, which are independent from the rest of the system are the MV/LV controllers, as well as the MV/MV controller. The simulations show that these controllers can successfully control the voltage values of the confined elements they are controlling. This contrasts from the results of the DSA simplification guidelines, which only identified one subset of the controllers that the dynamic simulations allowed identifying.
In terms of “Reduction of Number of Dynamic Simulations”, it is seen that the results of the dynamic simulations allow undermining the event “Change of Topology”, which is the same identifies by the DSA simplification guidelines. Nevertheless, the simulations show that there are additional situations in which the dynamic simulations may be undermined in the “Change of Active Power” events.
Figure 13 shows an example of one simulation in which negative influence among controllers are detected. Specifically, in the event of an active power ramp from the PV units, these sources consume reactive power according to the cos ϕ(P) controller. However, this action deviates the reactive power in-feed in the main transformer, and therefore the wind farms equipped with the Q(Q) controller inject reactive power to correct it, canceling the controlling effect of the PV sources, thus impacting the voltage module of the MV network.

Negative interaction of cos ϕ(P) and Q(Q) controller in Active Power ramp event. a Voltage in Main transformer with active power dependent set point, b Reactive power consumption of PV sources according to cos ϕ(P) characteristic, c Reactive power injection from Wind turbines according to Q(Q) controller, d Reactive power in-feed in main transformer
Based on these results, two performance metrics are defined to assess the effectiveness of the DSA simplification guidelines:
-
Efficacy of the guidelines: accuracy for which the guidelines predicted which simulations and controllers may be undermined.
-
Efficiency of the guidelines: proportion of the amount of simulation and controllers undermined by the guidelines, compared to the total amount of simulation and controllers that could actually been undermined (obtained through examination of dynamic simulations).
In terms of efficacy, it is noted that for this verification test in particular, the DSA simplification guidelines did not undermine any controller or simulation which is not discarded through the dynamic simulation analysis. This means that the guidelines are able to correctly simplify the DSA, without incurring into false positive situations.
In terms of efficiency, the guidelines could effectively predict which controllers are not required in a 50% of the cases determined through the analysis of the dynamic simulations. Indeed, out of the 12 controller combinations, the guidelines determined that in six of them, only 124 out of the 245 controllers are needed to perform DSA. Additionally, the guidelines could effectively predict 21,4% of the simulations that are not required for DSA, out of the 28 simulations that are identified as not required by the analysis of the dynamic simulations.
Discussion and conclusions
The purpose of defining DSA simplification guidelines is to execute a static analysis which identifies the interactions between the distribution system and its controllers in a general approach, while reducing the necessity of dynamic simulations analysis, thus lowering the computation effort needed to perform DSA.
To achieve this, a CIC is defined, which is one of the inputs of the DSA guidelines and the sub-contribution of this works. Its aim is to organize the variables of the distribution system, and identify which of them are influenced by the controllers, based on the inputs, outputs and control philosophy of the controllers.
The findings of this work show that the DSA simplification guidelines are correctly and accurately identifying situations, which can be undermined for DSA analysis, which shows an efficacy of 100%. Nevertheless, its low efficiency brings space for improvement and is due to the limitations of the guidelines.
These limitations are attributable to the process of creating the Controller Influence Chart (CIC), which require a substantial understanding of the distribution system under study. Indeed, its creation carries inherent limitations to the identification of possible interactions between the power system and the controllers:
Generality limitation: The general information in which the CIC is based brings limitations when the guidelines are implemented in practical situations. Specifically, the limitations of particular modeling software are not taken into account in the conception of the CIC, and some variables may be lost. As an example, the representation of the models may have inputs or outputs which are not accessible in other modeling software.
Decision limitation: The conception of the CIC requires a decision making process with a deep understanding of the distribution system topology and the controller’s characteristics. Therefore, a smart automatic decision agent is needed to employ these guidelines for DSA.
It is also highlighted that a more sophisticated ICT infrastructure results in a complex system with several dependencies that are difficult to study with conventional methods. Because of this, further proposed work is the extension of these guidelines to consider ICT problematics, through the combination of diverse tools that allows to create a co-simulation technic. In this case, the nature of ICT common problems (Konstantopoulos et al. 2010) (i.e. jitter, bandwidth, through-put issues) require statistical rather than deterministic assessments.
Abbreviations
- DSA:
-
Dynamic security assessment
- ICT:
-
Information and communication technologies
- CIC:
-
Controller influence chart
- HV:
-
High voltage
- MV:
-
Medium voltage
- LV:
-
Low voltage
- WF:
-
Wind farms
- PV:
-
photovoltaic
References
Andr, F, Br R, Strasser T, Member S (2014) IEC 61850 / 61499 Control of Distributed Energy Resources: Concept, Guidelines, and Implementation 29(4):1–10.
Arghandeh, R, Von Meier A, Mehrmanesh L, Mili L (2016) On the definition of cyber-physical resilience in power systems. Renew Sust Energ Rev 58:1060–1069. https://doi.org/10.1016/j.rser.2015.12.193. 1504.05916.
Babazadeh, D, Nordström L (2014) Agent-based control of VSC-HVDC transmission grid - A Cyber Physical System perspective In: 2014 Workshop on Modeling and Simulation of Cyber-Physical Energy Systems, MSCPES 2014 - Held as Part of CPS Week, Proceedings.. IEEE, Berlin. https://doi.org/10.1109/MSCPES.2014.6842398.
Bie, Z, Lin Y, Li G, Li F (2017) Battling the Extreme: A Study on the Power System Resilience. Proc IEEE 105(7):1253–1266. https://doi.org/10.1109/JPROC.2017.2679040.
Ciapessoni, E, Cirio D, Massucco S, Morini A, Pitto A, Silvestro F (2017) Risk-based dynamic security assessment for power system operation and operational planning. Energies 10(4):475. https://doi.org/10.3390/en10040475.
im VDN(FNN) (2014) Vergleich von technischer wirksamkeit sowie wirtschaftlichkeit zeitnah verfügbarer verfahren zur sicherung der statischen spannungshaltung in niederspannungsnetzen mit starker dezentraler einspeisung.. VDE FNN Netztechnik/Netzbetrieb, VDE Verlag, Berlin.
Jakus, D, Vasilj J, Sarajcev P (2015) Voltage control in MV distribution networks through coordinated control of tap changers and renewable energy sources In: 2015 IEEE Eindhoven PowerTech, 1–6.. IEEE, Eindhoven. https://ieeexplore.ieee.org/document/7232391/.
Konstantopoulos, T, Anantharam V, Baccelli F, Denisov D, Foss S, Glynn PW, Zachary S (2010) Stochastic process in communication science. Isaac Newton institute, Cambridge. http://www.newton.ac.uk/event/SCS.
Lee, R, Assante M, Conway T (2016) Analysis of the Czber attack on the Ukranian power grid - defense use case In: Industrial Control System - Defense Use Case, 23, Washington. https://ics.sans.org/ics-library.
Mahmud, N, Zahedi A (2016) Review of control strategies for voltage regulation of the smart distribution network with high penetration of renewable distributed generation. Renew Sust Energ Rev 64(December):582–595. https://doi.org/10.1016/j.rser.2016.06.030. ISBN:978-958-8363-06-6.
Mayer, C, Babazadeh D, Lehnhoff S (2018) Resilience in digitized energy systems - opportunity or risk. Jg.159(5):66–73. ill., Lit.
Morison, K, Glavic M (2007) Cigre Working Group C4.601: Review of On-line Dynamic Security Assessment Tools and Techniques.
Nijhuis, M, Gibescu M, Cobben JFG (2015) Assessment of the impacts of the renewable energy and ICT driven energy transition on distribution networks. Renew Sust Energ Rev 52:1003–1014. https://doi.org/10.1016/j.rser.2015.07.124.
Otuoze, AO, Mustafa MW, Larik RM (2018) Smart grids security challenges: Classification by sources of threats. J Electr Syst Inf Technol. https://doi.org/10.1016/j.jesit.2018.01.001.
Pan, K, Teixeira A, López C, Palensky P (2017) Co-simulation for cyber security analysis: data attacks against energy management system In: 2017 IEEE International Conference on Smart Grid Communications (SmartGridComm), 253–258.. IEEE, Dresden, https://doi.org/10.1109/SmartGridComm.2017.8340668.
Panciatici, P, Heyberger JB, Bareux G (2014) Dynamic Security assessment: Challenges (An European TSO perspective) In: 2014 IEEE PES General Meeting | Conference & Exposition, 1–2.. IEEE, National Harbor https://doi.org/10.1109/PESGM.2014.6938852.
Sun, W, He X, Tang J, Jiang F, Jiang D, Zhang J, Liu P, He C (2016) Extended application of online security and stability analysis system in Liaoning power grid. China International Conference on Electricity Distribution, CICED 2016-September(Ciced):10–13. https://doi.org/10.1109/CICED.2016.7576325.
VDE (FNN) (2016) Voltage regulating distribution transformer (VRDT) – use in grid planning and operation. VDE FNN Netztechnik/Netzbetrieb, VDE Verlag, Berlin.
Velasquez, J, Castro F, Babazadeh D, Lehnhoff S, Kumm T, Heuberger D, Treydel R, Lüken T, Garske S, Hofmann L (2018) Co-simulation Set-up for Testing Controller Interactions in Distribution Networks In: 2018 Workshop on Modeling and Simulation of Cyber-Physical Energy Systems (MSCPES), 1–6.. IEEE, Porto https://ieeexplore.ieee.org/document/8405402/.
Acknowledgements
The authors acknowledge the support of BMWi funding party, in the context of the “Smart Grid resilience Laboratory” project.
Funding
Publication costs for this article were sponsored by the Smart Energy Showcases - Digital Agenda for the Energy Transition (SINTEG) programme.
Availability of data and materials
The datasets used and/or analysed during the current study are available from the corresponding author on reasonable request.
About this Supplement
This article has been published as part of Energy Informatics Volume 1 Supplement 1, 2018: Proceedings of the 7th DACH+ Conference on Energy Informatics. The full contents of the supplement are available online at https://energyinformatics.springeropen.com/articles/supplements/volume-1-supplement-1.
Author information
Authors and Affiliations
Contributions
SL developed the idea of analysing DSA in distribution networks. DB and SL contributed with the technical background to develop the final research question. JV conducted the literature survey and developed the controller models. FC conducted the simulations, analysed the results, developed the DSA simplifications guidelines and was in-charge of the development of paper. All of the authors have read and approved the final manuscript.
Corresponding author
Ethics declarations
Competing interests
The authors declare that they have no competing interests.
Publisher’s Note
Springer Nature remains neutral with regard to jurisdictional claims in published maps and institutional affiliations.
Additional information
Authors’ information
Felipe Castro obtained his degree in Electrical Engineering in 2013 at the University of Chile, together with his Master’s degree in General Engineering at the Ecole Centrale de Nantes (ECN-France), through a double degree programme. For three years he worked in a consultant firm specialized in power system studies. In 2018, he obtained a Masters degree in Renewable Energy at the University of Oldenburg (Germany), and currently works as a researcher in OFFIS.
Jorge Velásquez is an electrical engineer from Colombia. He worked as a consultant in energy efficiency and renewable energy projects all across Latin America. In 2013 he came to Oldenburg to study a master degree in the Postgraduate Program in Renewable Energies (PPRE) at the Carl von Ossietzky Universität Oldenburg. After one year he started working at the OFFIS as a student assistant where he developed his master thesis project “Evaluation and Comparison of Different Coupling Techniques between Hardware and Software Tools for Smart Grid Simulation” at the Simulation and Automation of Complex Energy Systems group. His current research interests include simulation and automation of control strategies with a focus on distribution power systems and grid integration of renewable energy technologies.
Davood Babazadeh is an R&D manager at OFFIS Institute for information technology in Germany since 2017. He received his first master degree in energy engineering from Sharif University of Technology - Tehran in 2008. Then, he worked in industry in the field of reliability analysis in power systems for four years. He received his second master degree in electric power engineering in 2012 and afterwards his PhD from KTH Royal Institute of Technology-Sweden with the focus on distributed control of hybrid AC/DC transmission grids. In 2016, he worked as an area manager in Swedish Center for Smart Grids and Storage (SweGRIDS) in Stockholm. His areas of research are focused on Smart grid and smart city resilience and reliability, power system automation and control as well as multi-domain co-simulation testbeds.
Sebastian Lehnhoff is a Full Professor for Energy Informatics at the University of Oldenburg. He received his doctorate at the TU Dortmund University in 2009. Prof. Lehnhoff is a member of the executive board of the OFFIS Institute for Information Technology and speaker of its Energy R&D division. He is chairman of the section “Energy Informatics” within the German Informatics Society (GI), Executive Committee Member of the ACM Emerging Interest Group on Energy Systems and Informatics (EIG-ENERGY) as well as an active member of numerous committees and working groups focusing on ICT in future Smart Grids.
Rights and permissions
Open Access This article is distributed under the terms of the Creative Commons Attribution 4.0 International License (http://creativecommons.org/licenses/by/4.0/), which permits unrestricted use, distribution, and reproduction in any medium, provided you give appropriate credit to the original author(s) and the source, provide a link to the Creative Commons license, and indicate if changes were made.
About this article

Cite this article
Castro, F., Velásquez, J., Babazadeh, D. et al. Systematic dynamic assessment for resilient operation of distribution networks. Energy Inform 1 (Suppl 1), 24 (2018). https://doi.org/10.1186/s42162-018-0034-2
Published:
DOI: https://doi.org/10.1186/s42162-018-0034-2