- Research
- Open access
- Published:
Load balancing of renewable energy: a cyber security analysis
Energy Informatics volume 1, Article number: 5 (2018)
Abstract
Background
In the coming years, the increase of automation in electricity distribution grids, controlled by ICT, will bring major consequences to the cyber security posture of the grids. Automation plays an especially important role in load balancing of renewable energy where distributed generation is balanced to load in a way that the grid stability is ensured. Threats to the load balancing and the smart grid in general arise from the activities of misbehaving or rouge actors in combination with poor design, implementation, or configuration of the system that makes it vulnerable. It is urgent to conduct an in-depth analysis about the feasibility and imminency of these potential threats ahead of a cyber catastrophy. This paper presents a cyber security evaluation of the ICT part of the smart grid with a focus on load balancing of renewable energy.
Method
The work builds on a load balancing centered smart grid reference architecture model that is designed as part of the evaluation with the help of SCADA system and smart grid experts. The smart grid load balancing architecture represented by the model is then analyzed using a threat modelling approach that is encapsulated in a tool called securiCAD. Countermeasures are introduced in the model to measure how much each improve the cyber security of the smart grid.
Results
The analysis shows that the main threat comes from the internet and is directly dependant on the level of internet access office users have coupled with their level of access on the OT zone. Supply chain attacks are also of great concern, i.e. the compromising of the software/hardware vendor with the objective of feeding rogue updates to assets, typically to install a backdoor. The general takeaway defense-wise is that it is of the utmost importance to increase efforts in securing the smart Grid in all the ways possible as they appear to be generally complementary.
Discussion
The obtained results raise concerns whether the architecture of the smart grid still remains satisfactory in today’s state of the cyberspace and the increased presence and sophistication of cyber threats. There are also concerns whether the proposed security measures, regardless of their evaluated effectiveness, are realistically implementable from both financial and practical point of view.
Conclusions
There is no silver bullet available to achieve full protection against cyber attacks. The smart grid remains a network of IT/OT machines with dataflows going between them. State-sponsored hackers given enough time and regardless of the defences in place will eventually make their way into a critical infrastructure such as the smart grid. While mitigations will not eliminate the threats, they will increase the cyber resilience of the infrastructure by increasing both its time frame and effectiveness. As such, in a time where usability, efficiency and practicality are at the front of every domain, innovations regarding these aspects should really be carried out with strong security in mind.
1 Background
Modern ICT architecture at larger organizations and domain specific architectures are typically composed of a large number of systems, used by many people and processes, interconnected to form a complex system-of-systems (hereafter referred to simply as system). These are gradually evolving systems and new functionality is added to accommodate new use cases with the challenge to maintain dependability and security for the entire system. Smart grids and the energy sector are heavily dependent on ICT and due to digitization and internet of things even more so in the future. The required solutions to cope with ICT architecture challenges range from improvements in current operational procedures to adaption of new technology and need to be considered carefully.
In the coming years, the increase of automation in electricity distribution grids, controlled by ICT, will bring major consequences to the cyber security posture of the grids. Automation plays an especially important role in load balancing of renewable energy where distributed generation is balanced to load in a way that the grid stability is ensured. Load balancing is one of the central features of a smart grid and the main focus of this work. Threats to the load balancing and the smart grid in general arise from the activities of a misbehaving or a rouge actor in combination with poor design, implementation, or configuration of the system that makes it vulnerable. Automation adds new attack vectors through which cyber attackers can enter and attack the networks of grid operators and offers other possibilities to cause physical damage to the electricity grid itself.
To estimate the overall level of vulnerability of a system, an enormous amount of factors need to be considered. It is not sufficient, or possible, to address all vulnerabilities within it. There is also a need to understand how these vulnerabilities relate to each other (so called structural vulnerabilities) in order to prioritize where to start (and where to stop). An example of how attackers exploit a mix of vulnerabilities throughout the system architecture is the Stuxnet attack (Langner 2011; Lee et al. 2016). The two attacks against Ukrainian Ukrenergo utility demonstrate the same kind of multistep complexityFootnote 1.
A common means of estimating the cyber security of a system in practice is to consult experts, e.g. network penetration testers or other auditors. While consulting experts certainly is valuable, the resulting estimates come with three significant limitations: they are only valid for 1) the time that they were carried out, 2) the parts of the system architecture that were studied by the expert, and 3) the competence of the consulted expert. These limitations are especially problematic given the dynamic nature of modern systems and the lack of resources available for analyses. Moreover, the identified architectural vulnerabilities need to be linked and prioritized. System designers and decision makers are thus in need of approaches that can help estimate the cyber security of their system in an easy-to-use and easy-to-understand fashion. While there are various approaches available for this purpose, most suffer from being either too general, and thus ultimately dependent on the user’s competence about vulnerabilities (Wang 2005) (e.g. Common CriteriaFootnote 2, OCTAVE (Alberts et al. 2003), CORAS (Lund et al. 2010), and the model by Breu et al. (Breu et al. 2008)), or too limited in terms of scope only covering parts of the vulnerabilities in the system (e.g. MulVAL (Ou et al. 2006; Huang et al. 2011), NetSPA (Ingols et al. 2009), or the TVA-tool (Jajodia et al. 2005)). Some tools also require extensive expertise for manual configuration, such as the cyber-physical cyber security analysis tools ADVISE (LeMay et al. 2011) and CyberSAGE (Vu et al. 2014). The authors of this paper use an advanced threat modelling and attack simulation tool that has been designed to overcome the mentioned problems and is based on numerous research studies (Sommestad et al. 2013; Holm et al. 2015).
Holistic and quantitative architecture evaluation approaches have been proven to be useful, but it is difficult and time-consuming to model complex systems, like the ICT part of a power system (Närman et al. 2009). Two main approaches have been proposed to aid the modelling; 1) automatic modelling using operational data (Holm et al. 2014) (Välja et al. 2016), and 2) reference models (Blom et al. 2016), (Korman et al. 2017). Automatic modelling mainly relies on data from network and vulnerability scanners. For the typical power ICT system however, running a scanner is dangerous; this type of software has a tendency to stop the business process the system is set out to support. Reference models on the other hand capture what architectures typically look like, how different IT landscapes and systems are implemented. Reference models capture what is common and can be assumed in the generic case (the most likely case to encounter). Using reference models can save modeling time and remove the risk of interrupting the services by an actual scanning process. Thus, reference models are better suited for modeling environments where data collection is not possible or limited.
In this paper we put forward a reference model for one of the main features of renewable energy driven smart grids, load balancing. The load balancing reference model of an ICT controlled power system has been designed and validated using sources and experts in the power domain. The model is devised in a format tailored to cyber security attack simulations so that it can be refined in specific cases. The model is implemented using an advanced threat modelling and attack simulation tool. A set of attack and defense strategy scenarios have been collected with the help of the same experts and are used for attack simulations to demonstrate how threat modeling analysis using the reference model can be conducted. The results of the analysis are used to discuss the cyber security posture of a typical smart grid load balancing setup.
The paper is organized as follows. Section Related Work introduces the related work, section Load Balancing of Renewable Energy describes the smart grid load balancing reference architecture and section Reference Architecture Models for Automated Threat Modelling the smart grid load balancing reference model. The analysis of collected attack and defense strategy scenarios are described in section Cyber Security Analysis and the paper is concluded with section Conclusions and Future Work.
2 Related Work
System modelling (Johnson et al. 2007), (Lagerström et al. 2013) and architectural modelling (Ekstedt et al. 2009), (Lagerstrom et al. 2011) including threat modelling (Ekstedt et al. 2015), (Johnson et al. 2016) have been proposed as a way to managing complex architectures. Reference architecture models have been used to facilitate system modeling (including threat modeling) through reuse and simplification.
Cloutier et al. (Cloutier et al. 2010) provide a comprehensive and systematic overview of the concept of reference architecture. In spite of varying specific understanding of the concept across scientific literature and practice, reference architecture is here seen as an artifact with the purpose to provide guidance for further developments. Further according to that view, a reference architecture usually captures the accumulated architectural knowledge of many man-years of work, ranging from why (e.g., value chain, application, etc.), what (e.g., systems, functions, etc.), to how (e.g., design views and diagrams, design patterns, etc.). According to (Cloutier et al. 2010), objectives of reference architectures include explicit modeling of functions and qualities above systems level and providing guidance in form of architecture principles and best practices.
Bernus and Noran (Bernus and Noran 2010) differentiate between two types of architectural models commonly proposed by architecture modeling scholars. The first, type 1 architectures, also called reference models or partial models, have the essence of generally applicable blueprints. The second, type 2 architectures, also called enterprise reference architectures, have the essence of life cycle architectures. In Generalized Enterprise Reference Architecture and Methodology (GERAM) (Bernus et al. 2012), the two types of architectures correspond to the concepts of Partial Enterprise Model (PEM) and Generalized Enterprise Reference Architecture (GERA), respectively. In literature however, the term reference architecture often refers to a type 1 architecture (reference model).
In the context of this work we define a reference architecture model as a model of a system architecture (or a part of it) that captures the aspects with high level of commonality between different implementations of the architecture (e.g. different implementations of a SCADA infrastructure). A reference architecture model both mediates what is typically found in different implementations of a particular architecture, and supports the reuse of model content, by which it aims to simplify efforts on modelling such architecture.
Several studies attempt to provide general models of reference architectures or guidance in design of reference architectures. Examples include Nakagawa et al. (Nakagawa et al. 2012) for enterprise reference architectures, Angelov, Grefen, Greefhorst (Angelov et al. 2009) and Galster, Avgeriou (Galster and Avgeriou 2011) for software architectures, Irlbeck et al. (Irlbeck et al. 2013) for smart energy systems. Moreover, CEN, CENELEC, and ETSI have prepared a technical reference architecture for smart grids which integrates subsystem architectures and describes functional information data flows. One of the deliverables of that work is the Smart Grid Architecture Model framework (SGAM) (Group; Gottschalk et al. 2017). Trefke et al. have used SGAM for smart grid architecture use case management (Trefke et al. 2013), and Santodomingo et al. (Santodomingo et al. 2014) propose a SGAM-based methodology to analyze and compare different smart grid system architectures.
Further toward cyber security management, the literature offers a variety of methods and tools for analysis. Cherdantseva et al. (Cherdantseva et al. 2016) conducted an overview of cyber security risk assessment methods. The work focuses on state of the art and the authors list 24 methods. Eleven of those methods deal directly with SCADA systems in power sectors, other methods do not mention a specific sector. The purpose of the methods ranges from supporting system design to the quantification of vulnerabilities in a system. Most studied methods are based on models, the others make use of formulas. The complexity in some methods is handled using probabilistic calculations and graphs. In those cases, the data for risk calculation comes from expert judgments, historic data or both. Cherdantseva et al. find that for the majority of the methods no software or prototype to support and simplify analysis is avaliable. When there is a tool available, an expert user is required, as the tools are complex and based on either MATLAB, SHARPE or FORTRAN.
In more architecture oriented cyber security literature, we can find multiple reports and studies looking at electrical utilities. Searle et al. (Searle et al.) provide guidance for security testing in electrical utilities. Lee (Institute) presents a set of high risk failure scenarios and attack trees for a number of architectures commonly found in electrical utilities. Although the report does not describe the underlying architectures in detail, it complements such existing models with specific failure scenarios and attack trees. The Smart Grid Cybersecurity Committee (Smart Grid Interoperability Panel – Smart Grid Cybersecurity Committee) provides a highly comprehensive guidelines for cyber security in smart grids.
Although the models and content presented in (Smart Grid Interoperability Panel – Smart Grid Cybersecurity Committee) and (Gottschalk et al. 2017) lie closest to the form of reference model this study proposes; these works mostly describe functions and data flows, omitting more detailed technical properties of the different networks, systems and components present in the architecture.
There have been attempts at combining and extending existing architecture models and guidelines. Uslar, Rosinger and Schlegel (Uslar et al. 2014) present the first attempt of aligning European Smart Grid Architecture Model to the US Guidelines for Smart Grid Cyber Security (NISTIR 7628) to promote security integration already at the design phase. Jauhar, Chen and Temple (Jauhar et al. 2015) present a model based process for evaluating security risks with failure scenarios developed by US National Electric Sector Cybersecurity Organization Resource (NESCOR) Technical Working Group 1. The authors use the results to extend a cyber security assessment tool Cyber-SAGE (Vu et al. 2014). According to the authors, Cyber-SAGE is designed to reduce the assessment effort with reuse of models across failure scenarios, systems and attacker profiles with ‘what if’ type of analysis. While Cyber-SAGE tool is similar to securiCAD in purpose, unlike securiCAD it requires users to manually compose attack steps relevant to a particular architecture (a time consuming and costly activity requiring human expertise in cyber-security). SecuriCAD comes with a comprehensive set of attack graphs and defense mechanisms defined.
This study attempts to fill the gaps in the literature by extending the mostly functional and data flow oriented reference architecture models with technical details that are necessary for accurate automated security evaluations and automated simulations of cyber attacks and further proposing a cyber security focused reference architecture model on load balancing of renewable energy specifically.
3 Load Balancing of Renewable Energy
Load balancing renewable energy is a way of automatically controlling distributed generation, to balance the renewable energy supply to the demand, in a way that regional congestion is avoided, and the grid stability is secured. A Supervisory Control and Data Acquisition (SCADA) system, placed at the Distribution System Operator (DSO), is responsible for receiving and processing all the metering information, and supports in the decisions whether to increase or decrease the Medium Voltage (MV) Distributed Energy Resources (DER) generation, based on current demand and load forecasts. Load forecasts are a predication of future loads in the distribution system and are calculated based on historical data and other parameters like weather forecasts, special days (e.g., holidays), etc. The DSO SCADA system is constantly acquiring data from the loads and generation units, and, if required, issues controls by sending set-points to the Remote Terminal Units (RTUs) at the DER. This capability allows for (i) taking the most advantage of distributed generation to meet consumption needs and (ii) avoiding failures in the grid and thus, increasing the quality of service.
The sections below describe the main components of the smart grid and the various communication flows happening between them to achieve load balancing of renewable energy. A graphical overview of the different networks is depicted in Fig. 1.

Diagram of a typical smart grid network
3.1 Main Components
In the following sections we describe the main components of the smart grid, owned or not by a DSO, directly or indirectly involved in load balancing of renewable energy.
3.1.1 SCADA System
DSOs use a system to connect substation and field control equipment via a telecommunication network to a central control system to be able to monitor and control power grid in real-time, i.e. to collect information about loads, power quality, state of circuit breaker and isolators and to send controls from a control room to the substation, e.g. to open circuit breakers. Thus, SCADA systems (Boyer 2009) play a central role for any smart grid and are a key component in load balancing for renewable energy.
The main components of the SCADA system are a central control system including a Human Machine Interface (HMI), RTUs and a communication system. The central control system is communicating with RTUs through a system component called Front end. Human operators use SCADA trough HMI. RTUs are collecting analogue and digital states from sensors in the grid and include actuators to change the grid state by opening or closing breakers or sending set-points. Bigger, primary RTUs are placed in main substations responsible for converting high voltage (HV) to MV and secondary RTUs in substations along feeders responsible for converting medium voltage to low voltage (LV) (Padilla 2015). Substations are kept simple, i.e. without any advanced controls systems such as Substation Automation (SA) because it is not relevant for distribution networks. Indeed, primary and secondary substations in MV/LV networks are typically equipped with an RTU, and for secondary substations a very simple one (simple because of cost constraints).
3.1.2 Advanced Metering Infrastructure
The Advanced Metering Infrastructure (AMI) is an integrated system of smart meters, a separate communications networks, and data management systems that enables two-way communication between utilities and customers where the main function is to collect energy consumption data from individual customers (Wenpeng 2009). The AMI at the DSO is also responsible for sending customer data to a Data Hub Exchange System in order to enable the independent Energy Supplier to bill individual customer for their energy consumption. The DSO provides the Energy Supplier with DER metering data for produced energy.
A Smart Meter is an electronic device that records the consumption and generation of electricity and communicates periodically that information to the utility, both for monitoring and billing purposes. The Smart Meter also facilitates several other services both for the utility (e.g., remote switching, tariff changes) and the customer (e.g., efficiency services, consumption levels).
Data collection is normally done via Data Concentrators. A data concentrator is a communication device that acts as a local concentrator for meters in a neighbourhood and facilitates the connection to the Head End System (HES) of the AMI. The data concentrator is normally placed in the secondary substations and can also handle communication protocol and media conversions.
There are many countries with AMI systems under development and/or deployment. There are also many variants in the topology and specifications of the system, although most solutions are based on the existence of some kind of HES, which is in charge of storing and managing all the metering information retrieved from smart meters. The HES is also the target for commands to be delivered to meters, e.g. connection/disconnection of the customers to/from the network, change of settings, other commands and firmware upgrades.
3.1.3 Components owned by other stakeholders
All the components detailed above are normally owned by the DSO. However, there are other stakeholders taking part in the smart grid, each bringing several components to the infrastructure. Below is a list of components and their affiliated stakeholders, along with a description to highlight their purpose within the smart grid.
-
Energy Supplier System: the company or organization that owns units for generation of electrical energy, e.g. a wind park. Typically, customers, like households, have signed a contract with the energy supplier to provide them with electrical energy. The Energy Supplier uses the electrical grid, owned by a Transmission System Operator (TSO) or DSO, to transport energy to the customers. The Energy supplier normally owns the RTU at the site of the distributed generation, the DER RTU. Data collection and controls are, however, delegated to the DSO who is responsible for the balancing and stability of the grid. Data maintenance of the DER RTU, e.g. firmware updates, are done by the Energy Supplier.
-
Data Hub Exchange System: A data hub owner is an organizational entity that acts as a collector of information of customer loads and distributed production, facilitating the exchange of this information to the actors who need it. The Data Hub Exchange System securely gets information about customer loads and distributed production from DSOs and facilitates this resource (ensuring data minimization) to any stakeholder that requires such data for billing, market or regulation related services.
-
SCADA Hardware/Software Vendor System: Many DSOs have a support agreement with the SCADA system vendor. Such an agreement normally includes software updates and patches. Over Internet new updates and patches can be sent to a server in the SCADA DeMilitarized Zone (DMZ) of the DSO IT infrastructure and can then be transferred to the SCADA system or to the substation RTUs.
-
TSO System: The TSO Systems are Transmission System Operators’ SCADA and Energy Management System (EMS). EMS includes long lists of advanced mathematical applications for transmission grid, security and optimization. Normally TSO systems include load forecast that are transferred to the DSOs.
-
Telecom Operator: Communication networks between the central control systems and substations can consist of fibre, radio, mobile phone networks (GSM/GPRS), or Power Line Carrier (PLC). It is common that DSOs have their own fibre network for communication with primary substations. For communication with secondary substations, which exist in much greater numbers than primary substations, public mobile phone networks are often used since it would be too expensive to equip all secondary substations with radio communication or fibre.
-
Households: A Household has a smart meter to measure their energy consumption and is connected to the AMI system. The smart meter can also be used for identification of blackouts, remote switching in some cases, etc.
3.2 Communications
While knowing about the components that constitute the smart grid is important, knowing how these components communicate and for which purpose is essential for performing cyber security analysis, as dataflows make for the “highway of hackers”. Indeed, attacks happen when the target accepts some kind of data as input and interprets it. If the target is already receiving data from a trusted source, i.e. there is a dataflow between them, this flow can be subverted by an attacker (e.g. Man-in-the-Middle attacks). And if an attacker has compromised the trusted source beforehand, the panel of possible attacks increases further. Below is a list of the different kinds of data that are exchanged between components to accomplish load balancing of renewable energy.
RTU&IED Maintenance data. Determines how the RTU and Intelligent Electronic Device (IED) shall function. A typical example would be active power flow limits for a power line where Process Data (measured data) is supervised against such limits. Such maintenance data must be loaded to the RTUs and IEDs either by remote download from a central office or by local loading from a fixed or mobile workstation in the substations.
SCADA Maintenance Data. Similar to the RTU&IED Maintenance data but considerably more comprehensive. It includes all types of parameters that are necessary for the SCADA system to function properly.
Front-End Maintenance Data. Configuration data from the SCADA database that is downloaded to the Front-End system. This is typically data that concerns the Data Acquisition system like communication network topology, protocol definition, transmission speeds, etc.
Meter Configuration Data Parameters to control the functionality of Smart Meters and kWh meters. This data is downloaded to the meters from the AMI zone of the office environment using the DLMS protocols.
Process Data. Data measured from physical sensors in the supervised process and sent to the central SCADA system and data (controls) sent to the process from the SCADA system/SCADA operators. It should be observed the collection and display of process data and sending of controls is the core of a SCADA system.
Remote Substation Login. Represents the possibility for user in the central office of a utility to remotely login in to a primary or secondary RTU.
Historic Data. Mainly process data collected in the SCADA system and transferred to a Historian where the collected process data is time-stamped and stored in a historic database.
Sofware/Hardware Data. Updates of the SCADA Server, RTU and the IED firmware or software patches to correct bugs. This data is normally sent from the SCADA vendor to the DSO using the DeMilitarized Zone of the DSO.
Time Synch Data. Used to synchronize all clocks in the SCADA system including those of in the primary and secondary RTUs.
Load Forecast Data. Predicts future loads in the power grids. Load Forecasts Data is normally calculated at the TSO level and considers several external parameters like weather forecasts, special days, etc.
Meter Data. Energy usage by individual DSO customers. Meter Data is measured by and stored in a Smart Meter and sent to an AMI system on a regular basis using a separate communication infrastructure.
KWH Meter Data. Measurement of the energy production of a DER.
Internet data. All data available on the Internet, e.g. web browsing and emails.
4 Reference Architecture Models for Automated Threat Modelling
The purpose of this work was to formulate a reference model of a smart grid through one of its main features, load balancing of renewable energy presented in Section Load Balancing of Renewable Energy, in order to conduct a cyber security analysis. This section is dedicated to the description of the reference model. The first subsection gives insight into the security modelling and analysis tool (and its modelling language) that was used to assist in the cyber security analysis of the use case. The second subsection presents the reference architecture model that was designed using the tool, with details about the various hosts, networks, protocols, etc.
4.1 Reference Model Language and Cyber Security Analysis Tool
Since the objective is to analyze the cyber security of quite large architectures (in this case, the ICT part of the smart grid), there is inherently much uncertainty about details of the system design. It is virtually impossible to know every single detail of such large architectures, especially when what is modelled is a reference architecture model that cannot include all the small variations between different smart grid architectures. A probabilistic approach is therefore better suited to perform automated cyber security assessment. With that in mind, a tool was used for the design of the reference architecture model and the subsequent cyber security analysis. There are several tools proposed in the literature for the security analysis of cyber-physical systems, such as CyberSAGE (Vu et al. 2014), as well as commercial tools such as Skybox (Corp 2018) and RedSeal (Inc 2018), and securiCAD (foreseeti 2018; Ekstedt et al. 2015). Commercial tools are more generic, i.e. focused on ICT systems in general, and they are not freely available, but they propose built-in cyber security expertise. It was therefore decided to use securiCAD as it takes its roots from academia, is now a finalized product available on the market, and we had access to it.
securiCAD is a modelling framework and calculation engine that estimates the cyber security of systems-of-systems-level architectures. While being a commercial tool, securiCAD is based on results from previous research gathered in the Cyber Security Modelling Language (CySeMoL), an approach that has been extensively validated in the literature, both theoretically and practically (Sommestad et al. 2013; Holm et al. 2013; Holm et al. 2015; Blom et al. 2016; Korman et al. 2017). All the experiments presented in this paper were conducted using securiCAD rather than CySeMoL due to the improved analysis logic, performance, and usability. The perk of using this approach for cyber security analysis is that cyber security expertise is built-in, i.e. the configuration values regarding attacks have been preset. Such quantitative data was collected from various sources including surveys and studies such as (Holm 2014; Jonsson and Olovsson 1997), but also from public vulnerability databases such as the US’s National Vulnerability Database (NVD)Footnote 3 and China National Vulnerability Database of Information Security (CNNVD)Footnote 4. Therefore, security expertise is not required from users. Instead, users model their system architecture (e.g., services, operating systems, networks, etc) and characteristics (i.e. their level of protection e.g., if an operating system has a host firewall enabled, is patched, and is protected by an antivirus solution). From the modelled reference architecture, attack graphs are automatically derived and calculated, providing information on how difficult it is expected to be for an adversary to succeed with different attacks in the architecture. More precisely, given a starting point of attack, analysis results consist of:
-
An effort quantification of the whole attack surface in term of Time-To-Compromise (TTC).
-
An identification of the “shortest paths” (i.e. most imminent attack sequences) from the starting point to every asset of the modelled architecture.
Hence, rather than predicting the attacker’s behaviour, securiCAD’s analysis is about finding out what the attacker can do, how, and at what cost. The modelling language proposed by securiCAD that was used to design the reference architecture model contains 16 asset types:
-
Network: A Network asset is used to represent a network area/zone.
-
Router: A Router asset is used to represent a gateway between Networks.
-
Firewall: A Firewall asset is used to represent communication restrictions in a Router. A Router with no Firewall is regarded as a network bridge or a switch/hub.
-
Host: A Host asset is used to represent the kernel of a running operating system. It is typically connected to one or more Network assets. The hosts that are connected to the same network can communicate with each other without any restrictions in communication.
-
Client: A Client asset represents a piece of software able to establish communication via the network. It is the software that initiates communication on an information exchange.
-
Service: A Service asset is used to represent a piece of software that is ready to respond to client requests coming from a network. A Service is equal to an open network port.
-
Dataflow: A Dataflow asset is used to represent communication between a client and a service. In order for a dataflow to traverse a Router with a Firewall, the dataflow must be connected to either the Router or the Firewall.
-
Protocol: The Protocol asset is used to represent the protection level of a Dataflow asset/communication.
-
SoftwareProduct: The SoftwareProduct asset is used to represent the type of software run by the associated Host/Client/Service asset.
-
WebApplication: The WebApplication asset is used to represent a network service provided by a web server. Since a web application partly is run on the web server and partly may be run on the client side, by a web browser, the WebApplication asset represents both these parts.
-
AccessControl: An AccessControl asset represents some access restriction, commonly login functionality, for Host, Router, and Service assets.
-
UserAccount: A UserAccount represents the presence of an active user account in an access control mechanism.
-
User: A User object represents a person that has the credentials to a certain UserAccount.
-
Datastore: The Datastore asset represents logical storage of data, be it a file system, a database (or part of it), a directory or any data of interest and as such, can be affiliated with many different assets.
-
Keystore: A Keystore asset is representing a location where a collection of login credential information such as Active Directory, Kerberos or a local directory of private keys.
-
Attacker: The Attacker asset is used to state the starting point of the attack and therefore the attack scenario that will be analyzed.
To allow for quantitative cyber security analysis, assets have valued properties. In essence, the analysis is made possible by combining the modelling language described above with the attack graph (or rather its extension, the attack-defense graph) formalism (Sommestad et al. 2009). To that end, each asset contains a number of attack steps and defenses. For instance, the SoftwareProduct asset has defenses such as source code is secret, was improved with static code analysis, written only in safe languages, etc. and has attack steps such as find publicly disclosed patchable critical vulnerability, find public exploit for patchable critical vulnerability, develop zero day exploit, and so on. The attack graph follows the logic of a Bayesian network and is devised on a relatively high level of abstraction in terms of security properties (e.g. individual vulnerabilities are not considered only the general expectation of a system deploying the latest patches). This enables formal treatment and aggregation of uncertainty, both with respect to the knowledge of the system architecture and the knowledge of the cyber security domain. Formally, attack graphs are calculated using a probabilistic shortest path algorithm.
4.2 Model Design Process
The purpose of this work is to conduct a cyber security analysis of the smart grid-based use case as described in Section Load Balancing of Renewable Energy. We propose to first design a reference architecture model, and conduct the analysis on this abstracted, generalized but nonetheless accurate model.
On one hand, this work is the continuation of an ongoing study that relies on reference architecture models to perform cyber security analysis on different aspects of smart grids, where during the first iteration SCADA setups were analyzed (Korman et al. 2017), during the second iteration AMI (Korman et al. 2016; Blom et al. 2016) and during the third iteration substation automation commonalities were studied. The experience and expertise gathered during the previous studies allowed for the proper design of a larger, more complete reference architecture model of the smart grid.
On the other hand, the input data that were used to design the reference architecture model is a list of 50 dataflows, presented in Table 6 of Appendix, created by a reference group composed of experts working with Operational Technology (OT) systems in the utility sector, one of them having 40+ years of experience in SCADA Systems and is one of the authors of this article. This list is an attempt at collecting all the dataflows present in a modern smart grid that are necessary for the load balancing of renewable energy. In that regard, when considering all the dataflows happening in the smart grid, a certain amount was dismissed because it was deemed to be outside of scope (e.g., smart meter pushing, smart meter alarms, customer billing etc.). Still, several dataflows were modelled even though they are not directly related to the use case because they constitute an interesting attack path worth integrating to the analysis. Also, and despite the strong expertise from the reference group, assumptions were made in a few cases, usually regarding the initiator of a dataflow or regarding authentication. The objective is to use this list as a starting point for the design of the smart grid reference model, which in turn is used to perform automated cyber security analysis. Since describing each dataflow in this paper is impossible due to readability requirements and space constraints, only a few are described in the next section, and interested readers shall refer to the appendix for the complete list.
To ensure precision and accuracy of the analysis, it was decided to use a dataflow oriented approach to design the smart grid’s reference model, following three steps:
-
1.
The first step was to model each dataflow, one by one, with all the necessary assets: clients, services, protocols, hosts, networks, etc. If one of these assets had already been created when designing a previous dataflow, this asset was simply reused.
-
2.
Once all the dataflows were modelled, the second step was about verifying that networks were properly created, connected with each other, and contain the correct hosts. This consisted of first creating a global view of the network infrastructure, and then a dedicated design view for each network.
-
3.
The last step was about adding security controls, and is two-fold: (i) adding security assets, and (ii) configuring defense mechanisms. Adding security assets means adding firewalls to routers and creating authentication schemes (with user accounts and associated privileges) for services, clients, routers, but also adding centralized authentication for hosts (e.g., LDAP) with a domain controller (modelled as a host).
Regarding the analysis, in an effort to broaden the results, two structure variants were considered and effectively modelled. The objective of the first variant is to mimic (to some extent) the Ukraine attack on December 2015 and give relevant comparisons with more modern smart grid designs. As such, no SCADA DMZ has been modelled, which means that, for instance, the Historian and File Transfer Server are directly included in the SCADA network, and office users can directly connect to the SCADA HMI in that network for remote access. The other variant introduces a SCADA DMZ that contains a replicated SCADA, replicated SCADA HMI and replicated Historian, and the File Transfer Server has been moved to the DMZ. Therefore, office users can only connect to the replicated HMI, making it much harder for the attacker to progress into the network and reach his goal. Variants were chosen according to the current state of the practice, and each variant is based on real life experience from delivered systems configurations. Regardless of the variant however, it should be noted that the majority of the existing SCADA systems currently in operation are considerably older than the system modelled for this work and will have less protection against cyber-attacks. For example, most existing SCADA systems will not have an encrypted RTU communication between the central control room and the substation which makes the probability to succeed with a cyber-attack on the Wide Area Network (WAN) communication to be 100% if the attacker can get physical access to the communication network.
The remainder of this section illustrates the design process explained above, with a focus on the first variant, i.e. a SCADA system without a DMZ, but differences with the other variant are explained throughout.
4.2.1 Dataflows
As mentioned above, 50 dataflows were modelled to create the reference architecture model. A complete dataflow as represented in this model involves two hosts, the initiator and the target. The initiator must have a client, and the target must have a service. The initiator’s client and the target’s service are connected via a Dataflow asset. The dataflow must be connected to a Protocol asset, either encrypted or non encrypted. Hosts, clients and services must each be connected to a SoftwareProduct asset. The two hosts must belong to a Network asset, the same Network asset if they are part of the same network (e.g. a SCADA server and its HMI), or different Network assets if they belong to separate networks. For the latter, the two networks must be connected via a Router asset (and potentially other networks and routers in between). Moreover, there are secondary assets that can be connected to the main assets described above, such as DataStore assets (for instance connected to a service, meaning the service provides access to a database), or KeyStore assets (for instance connected to a dataflow, meaning credentials are flowing through the dataflow). These secondary assets are not mandatory for the cyber security analysis but they do provide with additional attack paths in certain cases.
As opposed to common practice in the power sector, there is no explicit direction of data transfer with securiCAD’s notation because the focus is not on data, their nature, criticalness and flow. Rather, the focus is on communication links, roles and privileges. Indeed, from a cyber security analysis point of view, what matters the most is to identify the initiator (e.g. the client) and the receiver (e.g. a service listening on a port for commands) because each implies a very different attack surface for the attacker. A service awaits for input, the attacker can send her/his attack and the service will either resist or break, while compromising a client means for instance that the attacker has compromised a service beforehand, to which the client connects to or will connect to. The attacker then needs to wait for the victim to initiate communication (for instance, a rogue Web application – a service – waiting to compromise the Web Browser –a client – of the victim). Following this logic, the consequences upon compromising are also different whether the targeted asset is a client or a service.
Showing all 50 dataflows is not possible because of readability issues. Instead, and to illustrate the creation of dataflows, two examples from the dataflow list are thoroughly explained in the next two paragraphs.
A first example is dataflow #30 that represents SCADA software updates requested by the File transfer server toward the Vendor server, as depicted in Fig. 2. The File Transfer Server is a host (on the left) that is part of the SCADA LAN. It has a software update client representing the process that queries the vendor server for software updates. This client has a dedicated software product (it was decided to model a proprietary internal software product rather than a third-party product), and is connected to the dataflow. The dataflow has a protocol (HTTPS in this case but it could also have been SFTP or a proprietary protocol), and is connected to the Vendor server (host on the right in the figure) through a dedicated service representing a “software update gate”, which also has an associated software product. The gate service is protected by access control, meaning that credentials are typically required to obtain software updates. Moreover, the service is connected to a Database, representing the software update repository. It means that the service allows whoever can communicate with it to access data on the datastore (given the proper credentials). Finally, this service is connected to the Vendor server as a “non-root application”, meaning that any client connecting to the service can only obtain data produced by the software run by the service, as opposed to a remote SSH connection for instance that provide a certain level of control on the owning host. The Vendor server is connected to its own network; therefore there must be a connection possible between the two hosts through networks and routers to allow the dataflow to circulate. The connection goes from the vendor network, out to the internet through the vendor router, enters the DSO public DMZ through the DSO perimeter router, and then reaches the SCADA zone through the DSO enterprise router. Finally, the dataflow is specified to go through the several routers all along its route. Defining a dataflow’s route also provides an attack path to the attacker, allowing for instance man-in-the-middle if the encryption can be broken (which has happened in the past with HTTPSFootnote 5). About the graphical notation, because only a subset of the model is shown here in the Figure (and more generally in any view of a reference architecture model), yellow boxes with numbers indicate the number of contained entities of a certain type in a container entity. This is because, in securiCAD’s notation, certain entities may contain others, for example a Host may contain one or several Clients and Services, a Network may contain one or several Hosts. For instance, the ‘FileTransferServer’ Host on the bottom left of the Figure contains two clients (the first yellow box is on a slightly bigger blue and white box, with inside a logo of a computer screen, the symbol for clients), and two services (the blue and white box here contains a drawing of workings, the symbol for services).

Dataflow #30 as modelled in securiCAD
Another example is dataflow #50, depicted in Fig. 3, which represents the ability for office users to remotely connect to the SCADA HMI. This dataflow keeps the same general logic than dataflow no.20, with a host (office computer) having a client (a RDP client) linked via a dataflow to a service (a RDP server) run on another host (SCADA HMI) and protected by an access control. The difference here is how the service is connected to the HMI: “root Shell execution”. It basically means that the attacker does not have to find a vulnerability in the software run by the service (for instance, a buffer overflow) to obtain full control of the HMI.

Dataflow #50 as modelled in securiCAD
4.2.2 Networks
Once all the 50 dataflows were modelled, the next action was to assess the network structure of the architecture to make sure that (i) networks have been properly connected to one another and (ii) hosts are part of their expected network. In total, 24 networks and 13 routers have been represented. In the following paragraphs the modelled networks are described, along with the hosts they contain and their various connections through routers. To follow the description logic initiated in Section Main Components, networks are grouped by stakeholders.
DSO. This is the largest and most complex part of the reference model, composed of many LANs:
-
SCADA LAN: It is the central part of the SCADA model where the main services are run and data is processed. The SCADA LAN contains the SCADA server that sends process data to the SCADA front-end and logs historical data to the Historian, which in turn duplicates historical data to the replicated historian in the SCADA DMZ, the Data Engineering (DE) server that sends maintenance data to the SCADA server, the Time Unit server that ensures all machines’ clock are properly synchronized, the File Transfer Server (only in the less secure variant) that sends software updates obtained from the vendor to the SCADA server, and the HMI and DE HMI that allow operators and engineers to view and control the power grid. Note that only one HMI and DE HMI were modelled, as having more than one of each (as it is in a real SCADA system) does not influence the calculation. It is also for this reason that the SCADA LAN is not doubled. The architecture view of the SCADA LAN is depicted on Fig. 4.
Fig. 4 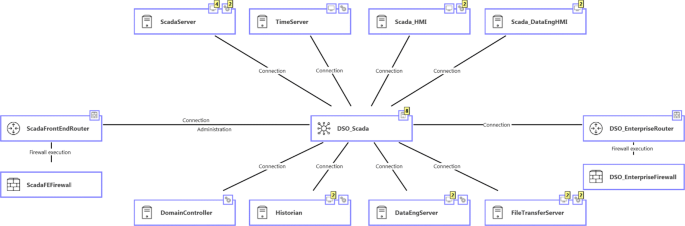
SCADA zone as modelled in securiCAD
-
Process LAN: This is the gateway to Process WAN where the measurements are collected from and new configurations saved to. The Process LAN contains a SCADA Front-End server, which transfers SCADA process data to the RTUs in all the substations (DER included).
-
SCADA DMZ: Only modelled in the more secure architecture variant, it is a duplicate of the main SCADA system that is accessible from the organisation’s office network. The purpose of this zone is making the information collected and processed by SCADA and application servers accessible in the office environment without exposing the control system directly to security threats and attacks. Hence, this network contains a replicated SCADA and a replicated Historian, both receiving data from their original equivalent, and the File Transfer Server (initially in the SCADA network in the less secure variant).
-
Office LAN: An important part of any SCADA configuration is interconnection to the office network where customer information is processed and maintenance workflows planned among other things. Three hosts were modelled: an office mobile with access to the internet, an office workstation with access to the internet and a secure connection to the SCADA HMI (or replicated HMI in the more secure variant), and an office application server that provides (power) applications to office users e.g., for planning purposes.
-
Maintenance (engineering) LAN: This is where the substation system maintenance is done from. This network contains an Element Manager (which sends maintenance data to RTUs in primary and secondary substations), an Update Server (which sends software updates to RTUs in primary and secondary substations), a Vendor File Transfer (to collect software updates from the SCADA software vendor), and an office machine. The Maintenance LAN has a dedicated connection with the software vendor to collect updates meant for the RTUs in the primary and secondary substations.
-
AMI LAN: As mentioned in Section Advanced Metering Infrastructure, the AMI’s objective is to collect meter data from private customers (households) as well as industrial customers. Logically, two AMI hosts were modelled, one for each type of customer.
-
Public DMZ: This network is exposed to the internet and represents the gate to the outside, meaning almost all traffic between the internet and any network owned by the DSO goes through this gate. As mentioned above, the exception is a direct connection between the Vendor File Transfer from the Engineering LAN and the hardware/software vendor, through the internet but not through the public DMZ.
-
Substation LANs: Geographically dispersed substations with varying configurations. A primary substation and secondary substation were modelled, each containing an RTU, and IED, and a local workstation that can send maintenance data to the RTU, as well as software updates. The local workstation, in the case of the primary RTU, is accessible by the engineering workstation through a Virtual Private Network (VPN) connection.

All these networks are connected together via the DSO’s Enterprise router. The public DMZ connects to the internet through the perimeter router. Networks owned by the other stakeholders are described below.
Energy Supplier. The Energy Supplier is represented with three networks. The first network is composed of two hosts, an element manager to send maintenance data to the RTU in the DER substation, and an energy supplier system responsible for collecting kWh data from the Data Hub System. This network is only connected to the internet. The second network is distant, at the DER substation, and consists of an RTU and a kWh meter that sends kWh data measured from DER toward the AMI for industrial customers. The Energy Supplier has a third network dedicated for administration.
Data Hub Owner. It consists of a network and only one host, the Data Hub System, which collects industrial customers’ kWh data and smart meter data initially collected by the dedicated AMI system. As for the Energy supplier, another network is also modelled for administration purposes.
SCADA Hardware/Software Vendor. The hardware and software vendor has two networks, one for administration and one that contains a server containing hardware and software updates, accessible to the DSO via a service gate, accessible from the internet. Typically, SCADA updates are downloaded by the File Transfer Server, and RTU-IED updates are downloaded by the Vendor File Transfer (engineering LAN).
TSO. The TSO has one network for administration and a network containing a database server that contains load forecast data and sends it to the File Transfer Server of the DSO to be transmitted to the SCADA server and used for load balancing.
Telecom Operator. Only networks were modelled for the telecom operator; a fiber network for communication from SCADA to the primary RTU, and a GPRS/LTE network for communications between SCADA and the secondary RTU, between SCADA and the DER RTUs, and between the energy supplier’s element manager and the DER RTU.
Households Just one household network was modelled, containing a smart meter, which sends kWh data to the dedicated AMI server.
Internet This network is central to the architecture as it is the main intermediary to the different stakeholders (along with fiber, GPRS networks from telecom operators). The internet was modelled with a Public Web server including a Web application to represent the World Wide Web (and thus provide with the proper attack surface), and a “rogue” host typically owned by the Attacker when the starting point of the attack is the internet.
4.2.3 Security Controls
So far, most classes in securiCAD representing security controls are not represented in the architecture, and were added afterward by making additional assumptions. First, all the modelled networks were protected with a Firewall asset, and all the routers were provided with a separated administration network. In addition, structures around user accounts and access control were added. Most hosts, clients and services are protected, which is represented with a relationship to a dedicated or shared AccessControl asset. Authorized access is modelled by creating relationships between an AccessControl asset and UserAccount assets. Generally, one admin and one regular user account per organization/Stakeholder were modelled. The DSO is however slightly more complicated with admins and users both on the IT and OT side. There are also separate users and admins for the AMI and the substations. On the OT side, oftentimes services are left with no access control enforced, as it is the case in many power grids today: the OT is deemed safe from unauthorized access. For example, the historian’s database service in the SCADA LAN has no access control. Note also that the model does not introduce IDS, IPS or the use of vulnerability scanning (which are available security mechanisms in securiCAD). The authentication scheme for the SCADA zone is depicted in Fig. 5.

SCADA centralized authentication as modelled in securiCAD
Despite localized access controls, centralized authentication was also modelled in several occasions. An administration LAN was created as part of the DSO architecture. This network contains a domain controller (modelled as a host) that provides authentication for office users on their machines in the office LAN. The domain controller has a Service asset that offers authentication, and office machines all have an authentication Client asset. A dataflow for each office machine was created, connecting their authentication client to the domain controller’s authentication service. Similarly in the SCADA LAN, a SCADA domain controller was added and all hosts have an authentication Client asset and associated dataflow toward the domain controller’s authentication service.
Finally, the defense mechanisms present in most of the modelled assets were configured. Configuring defense mechanisms means that, for each instantiated asset, each of its defense mechanisms is parameterised with a probability of existence: 0 means that the defense is nonexistent, 1 means the defense is in place with a 100% certainty, and 0.75 means there is a 75% probability that the defense is active. These parameter values influence the overall analysis as it is based on a montecarlo simulation: calculation is run a thousand times (hence a population of a 1000 penetration testers), and each time the (Bernoulli) probability distributions of defense mechanisms are sampled, deciding which defense mechanisms exist for the current calculation. In order to bring genericity to the obtained results (as well as ease the modelling), it was decided to use batch set values by distinguishing the commonly referred to IT-OT gap. Assets classified as OT (SCADA, SCADA Front-end, SCADA WAN and substation zones) were set to one default configuration, and assets classified as IT (all other zones) were set to another default configuration. Protocols were however modelled individually according to the dataflow descriptions. Two sets of IT/OT defense configuration settings were used in the analysis, a less secure configuration and a more secure configuration, both reported in Table 7 (see Appendix). They mainly differ when it comes to software patching (be it operating systems, regular applications or web applications), firewall configuration, access control settings, and employees’ security awareness. The more secure configuration represents a modern, state-of-the-practice system that was delivered in recent years. This basically means that the utility using this system is security aware and has tried to protect the system against cyber-attacks using the existing abilities of the chosen SCADA vendor. Contrariwise, the less secure configuration represents a system that would be in place for more than three years, with less effort to protect the system against cyber attacks, which is more representative of the current status of the power grid, whatever the country. The differences between the two configurations may appear thin in Table 5, but analysis results (as presented in Section Cyber Security Analysis) show sensitive differences between the two configurations in how hard it appears to be for the attacker to reach his goals.
4.3 Model Variants for Analysis
Assessing the current cyber security status of the smart grid in general is of great value, but a truly important aspect of this type of activity is to compare different architecture variants and measure how certain security mechanisms perform. A security mechanism can be structural/physical e.g., a more advanced network segregation, and/or software based e.g., a more frequent patching strategy. Of course, the different security mechanisms can be combined in an effort to find out which combination yields the best results. In this study, several architecture variants were made up from different configurations. As explained throughout Section Model Design Process, two dimensions were considered:
-
Two structure variants: A model with increased network segregation with the SCADA system having a DMZ to ensure remote access to the actual SCADA servers is not possible, and a simpler model without a DMZ where, for instance, office users can remotely connect to the SCADA HMI in the SCADA LAN.
-
Two defense configuration variants: A less secure configuration, and a more secure configuration with increased software patching, firewalls with stricter rules, access control with stronger encryption, and employees with better security awareness.
These two dimensions are combined, resulting in 4 model variants A, B, C and D. Below is a description of each variant:
-
Model variant A: Combination of the NO SCADA DMZ structure variant, with the less secure defense mechanism configuration.
-
Model variant B: Combination of the NO SCADA DMZ structure variant, with the more secure defense mechanism configuration.
-
Model variant C: Combination of the SCADA DMZ structure variant, with the less secure defense mechanism configuration.
-
Model variant D: Combination of the SCADA DMZ structure variant, with the more secure defense mechanism configuration.
These variants will be referred to as model variants A,B,C and D in the rest of the article. Note that the variants only claim to be representative and generally common, they do not represent any specific system.
5 Cyber Security Analysis
It is common practice, when performing cyber security analysis, to orientate the analysis using attack scenarios, i.e. by defining attacker starting positions and assets with high value (e.g. a host or datastore to be protected) to protect. This allows for the calculation of the possible attack paths and estimate the probability to succeed with the attack. For this study we focused on the following attack positions, which are supported by the reference group of experts who provided the dataflow list:
-
On the Internet;
-
At the vendor;
-
At the Smart Meter in a household;
-
At the Energy Supplier.
It was decided to measure the cyber security of the architecture by focusing on the following targets (of course, any other asset could have been chosen as a target, but we believe these assets are good representatives of the architecture’s status):
-
The central SCADA System, more precisely one of the SCADA servers of the SCADA HMI in the SCADA zone;
-
The RTUs in the primary & secondary substations (results regarding 1st and 2nd RTUs were grouped because they were similar for all the analyses);
-
The RTUs in DER substations.
These attack starting points and target assets constitute the scope of the study. Of course, there are many other potential starting points and target assets in the reference case. For instance, it would have been interesting to look at the possibilities of the attacker from the smart meters to, say, influence billing data. However, this is outside the scope of this study, and will potentially constitutes a new study.
The 4 attacker positions are combined with the 4 model variants A, B, C and D previously defined. This makes for 4∗4=16 scenarios for which the results are presented in Tables 1, 3, 4, and 5. Figure 6 provides a more detailed, combined overview of all attacker types and scenarios. The colored bars in the figure indicate the estimated distribution of time(in days) to successful attack for top portions of the attacker population: up to 5% of attackers (blue), 5-50% (green), 50-95% (orange), and 95-100% (red). The exact TTC values of the three portions are also given as a triplet for each target. The black stripe between the green and orange bar indicates the time at which 50% of the attacker population would succeed with the attack.

High level overview of the analysis results
The results of the security evaluation, as obtained with securiCAD, come in terms of a reachability map from the attacker’s starting point and to the targets (i.e., all attack steps that are defined for each single entity present in the model). The reachability of each attack step by the modelled attacker is represented by the distribution of TTC across the population of professional penetration testers. For practical purposes, it was decided to use the attack graph formalism proposed by Ou et. al. (Ou and Singhal 2012) to present the reachability maps as it provides better readability and allows for aggregation. It features two types of nodes: exploit nodes (shaped as ellipses) and privilege nodes (shaped as diamonds). Exploit nodes can be seen as actions from the attacker, and privilege nodes can be seen as the obtained result. Oftentimes, securiCAD proposes several attack paths that lead to the activation of an attack step, i.e. the main attack path but also alternative paths that takes a longer time to achieve but can still yield interesting results. Hence, the main attack path is always depicted here, and alternatives paths are sometimes included when they highlight critical vulnerabilities not being exploited as part of the main attack path. It should be noted that this multi-path representation only expresses the effort related each path, the main path being the one associated with the least effort, but does not say anything about what the attacker will choose to do. The purpose of this study is not to predict the attacker’s behaviour, but rather to measure the required effort for an attacker to move from her/his starting point to the targeted asset. Moreover, the TTC values of the targets are expressed in days, meaning that, from a defined population of professional penetration testers, it will take X days at most for the 50% of the population to compromise the host. The population was set to 1000 testers, and the upper limit of this time was set to 200 days due to the algorithmic complexity of the evaluation and convenience – to constrain the time of the evaluation process. In the following sections, we refer to the 50% of the population that reached the target simply as “‘the attacker”.
A high level overview of the results is presented in Fig. 6. Scenarios are explained in detail in the subsections below, grouped depending on the starting point of the attacker.
5.1 Attack Scenarios from the internet
Results with the attacker positioned on the Internet are presented in Table 1.
The most severe scenario is variant A: it would take only 27 days for the attacker to get a hold of the SCADA server, and only a few more days to control the RTUs. The main attack path from the internet to the compromising of the SCADA server is depicted in Fig. 7. First, the attacker performs spearphishing toward the office user by exploiting a Cross-Site Scripting Vulnerability on a public Web application that the office user is browsing (dataflow #50), and therefore “hooking” the office user’s Web browser with malware, thus compromising it. With a certain control over the hooked browser, the attacker is able to harvest credentials and eventually compromise the office computer. Second, from the office computer, the attacker pivots to the SCADA HMI, as there is an existing connection between the two hosts (dataflow #21). Before getting a hand on the HMI however, the attacker has to harvest credentials. Finally, the attacker penetrates into the SCADA network, it is now possible from him/her to connect to the SCADA server via the HMI (dataflow #17), to eventually elevate privileges and fully control the SCADA server. This attack path is very interesting because it almost completely mimicks what happened in Ukraine in 2015 (Lee et al. 2016): spear phishing attack towards the office user (although here it is through the compromising of a public Web application) and getting control of the HMI and therefore of the SCADA server. Two alternative attack paths, albeit less probable, are also proposed: (1) the attacker could also hook the Web browser of the DSO engineer sitting in the Engineering zone instead of the office zone in order to reach the SCADA HMI, and (2) there is a slight possibility for the attacker to reach the SCADA server by intercepting software updates sent by the File Transfer Server.

Aggregated attack graph of an attacker positioned on the internet
The second most severe primary scenario is variant B. The main attack path that was computed is similar than the first discussed path. The main difference is that, because of the increased defences, it will take the attacker more than twice the time to pivot through the network and compromise the SCADA server and RTUs. Instead of exploiting publicly disclosed vulnerabilities that were still present due to inconsistent patching strategies, the attacker first has to find zero days and then create and deploy corresponding exploits to further advance in the network. Because the attacks are similar in nature, no attack graph is presented for this scenario.
The third scenario is variant C. The attack path remains identical at first: compromising the office user’s computer. However, because of the added DMZ, compromising the replicated SCADA HMI does not provide the attacker with much to work with. Instead, s/he first compromises the replicated historian’s service, and from there compromises the main historian’s client (which is connected to the replicated historian’s service to send data). Once in the SCADA network through the Historian however, the attacker can reach the SCADA server because its services do not require authentication (any host connected to the SCADA network can communicate with the Scada server’s services).
The least severe main scenario is variant D. The attacker has to penetrate a network with an extra DMZ and where patching has been more consistently performed. Still, compromising the SCADA server and RTUs is still doable, but it requires a much greater effort.
Note that two additional scenarios were added with the attacker on the internet. These scenarios are only studied because they are not common practice but they represent features that could still be integrated in a smart grid, and therefore a first overview of their cyber security performance is of interest. The first case depicts office users who can peek on process data on the SCADA HMIs through a web server hosted by the HMIs. Because office users will use a regular Web browser to access the HMI, this offers a bigger attack surface to the attacker. The second case concerns a situation where the SCADA zone is opaque, meaning that all the hosts can only dial the outside, but do not accept requests. The objective is to show that security issues arise when hosts accept requests from the outside. Results from these two cases are presented in Table 2. The special case with HMI Web Server is a similar scenario than the one with variant A, except that the SCADA HMI provides a certain control over the SCADA server via a Web service. Therefore, when the attacker hooks the Web browser of the office user, it is all s/he needs to get control over the SCADA HMI (no need to fully compromise the office computer). As a consequence, the SCADA server and the RTUs are shown to be compromised much faster. The takeaway from this analysis is that it represents an additional security risk to use IT software for OT purposes. There should not be a possibility to, in this case, browse the Internet and perform actions on the SCADA HMI using the same Web browser. Finally, the second special case, where the SCADA zone does not accept data from anywhere except from the RTUs, appears to be (as expected) the least vulnerable of all scenarios. The only option left for the attacker is to compromise the DER RTU (since it has a VPN connection toward the Energy supplier) and then back to the SCADA zone. Needless to say, this situation is highly unlikely but it is however not completely impossible.
5.2 Attacks from the Software/Hardware Vendor
Table 3 presents the vulnerability assessment of the use case if an attacker had been infiltrating the Software and Hardware vendor (or an insider). This situation appears to be quite alarming and represents a big threat that must be taken into account. Indeed, for variant A, it only takes 13 days for the attacker to get a hold of the SCADA server, by first compromising the File Transfer Server (which is on the same network in this scenario). Results are similar in essence with variant B, which makes sense because of the very few lateral movements that are required for the attacker and the very few vulnerabilities that must be exploited. The main attack graph is depicted in Fig. 8.

Aggregated attack graph of an attacker positioned at the software vendor
For variant C, it becomes much harder for the attacker to get to the SCADA server (and thus to the RTUs). It can be explained because of the extra network (the SCADA DMZ), but also because the hosts that are part of this network are considered to be part of the IT, which means the File Transfer Server is set wich much stronger defenses. It takes 53 days for the attacker to get to the File Transfer Server and then to the SCADA server. For variant D, it is the same attack path but again with a greater effort needed from the attacker, as zero day exploits are required to progress further. Another harder but still viable option for the attacker at this stage is to reach the internet from the vendor, and then perform the main attack path explained during the first scenario (attacker on the internet).
It should be mentioned that, in these scenarios involving an attacker sitting at the vendor, securiCAD depicts a somewhat too secure picture of the use case. Indeed, it is not possible to define the nature and criticality of dataflows. Hence, it is not possible to model the fact that, if the attacker obtains the ability to temper with software updates, it is merely a question of days, regardless of the variant and defense configuration, before a malicious update is passed on to the SCADA server and RTUs. On the other hand, another characteristic of hardware and software updates that is not specified here is their frequency: usually, updates are sent quarterly. It would therefore reduce the possibilities for the attacker to send a malicious update, given that the schedule for a new update might be far in the future.
5.3 Attack Scenarios from a Smart Meter
The results presented in Table 4 are for an attacker positioned on a smart meter, in a victim’s house. This scenario is the more complex for the attacker, as shown in Fig. 9. For variant A, it will take 78 days to compromise the SCADA server. First, from the smart meter, the attacker manages to craft an input that will exploit a vulnerability in the AMI Private houses host (via Dataflow #44). Once in the AMI LAN, the attack pursues by compromising the Office Application Server (via Dataflow #45). Now in the Office Zone, the attacker managed to get a hold of an office Computer, and then make his/her way to the SCADA server and RTU via the SCADA HMI. It is complex for the attacker because the smart meter only has services to work with (first the smart meter, then the AMI private houses, and then the Office Applications Server), until reaching the Office Zone.

Aggregated attack graph of an attacker positioned at a smart meter
With variant B, it becomes much harder for the attacker to reach the targets (the 200 days threshold defined for the calculation is just attained). The main attack path is similar, but the increased patching and security training makes it much less probable. The attacker reaches his goals within 172-200 days depending on the target.
Interestingly enough, variant C appears to provide a thinner layer of security than increasing the defenses. The attack flow is also similar up to the compromising of the office computer, but going through the DMZ as an additional step. The reason for stronger defense being more efficient in this scenario comes from the fact that there are many attack steps from the smart meter all the way to the SCADA zone. If the defenses are low, it is not too hard for the attacker to go from one host to another. A DMZ adds more steps, of course, but these steps are not harder to break. However, if defenses are turned on in a more systematic way, each attack step becomes much harder for the attacker. Therefore, the longer the attack path, the more efficient it is to focus on having strong defenses.
An interesting alternative attack path (although even less probable) consists of, once in the AMI network, compromising the AMI for Industrial customers, pivoting to the Data Hub, then the Energy supplier, down to the DER RTU, and then reaching the SCADA server in the SCADA zone by first compromising the SCADA FrontEnd.
With variant D, it becomes virtually impossible for the attack to progress into the network, within the maximum time frame of 200 days. The main attack path is similar, but the increased patching and security training makes it much less probable. The attacker reaches his goals within 200 days with a probability of 37-50%, depending on the target.
5.4 Attack Scenarios from the Energy Supplier
The analysis results with an attacker positioned at the Energy Supplier are shown in Table 5. Two hosts have been modeled at the Energy Supplier: An Element Manager and an Energy Supplier System. It was decided, for more meaningful results, to put the attacker on the Element Manager rather than the Energy Supplier System, because the latter has much less interactions with the other hosts of the network. The main attack graph and an alternative are depicted in Fig. 10.

Aggregated attack graph of an attacker positioned at the energy supplier
This scenario differs a bit from the others, in the sense that the SCADA server here is compromised last. The main attack path for all scenarios is an attacker starting at the Element Manager of the Energy Supplier and then directly moving onto the DER RTU via the existing VPN connection. With variant A, 14 days are necessary to compromise the DER mainly because of the secured communication between the Energy Supplier and the DER Substation. The attacker needs to figure out the credentials of the VPN connection, for instance. It is important to understand that saying an attacker “starts” on a given host does not mean s/he is physically sitting in front of it, hence it requires more work to understand the nature of the host, harvest credentials, and only then pivot onto the next target. Moreover, this means that adding a SCADA DMZ, i.e. variant C, does not provide another layer of security since the attack occurs through the DER RTU. As a consequence, variant A and C are deemed similar during calculations, as well as variant B and D. An alternative attack path consists of going on the Internet from the Element Manager and perform the main attack path from the Ukraine attack. This alternative is however dismissed because redundant and therefore not relevant.
The most interesting part of this scenario is that, no matter the variant, results show that the cyber security of the smart grid is at great risk if the attacker is to compromise an entity such as the Element Manager of the Energy Supplier.
6 Discussion
A complete cyber security analysis of the use case was conducted using securiCAD, divided into 18 subscenarios. Attack-wise it appears that the main threat comes from the internet and is directly dependant on the level of internet access office users have coupled with their level of access on the OT zone. Therefore, cutting this indirect link between internet and OT, either by denying internet access to office users or preventing them from accessing the OT zone in any way, is a necessary precaution. Supply chain attacks are also of great concern, i.e. the compromising of the software/hardware vendor with the objective of feeding rogue updates to assets, typically to install a backdoor. This is especially true in light of the recent supply chain attacks such as NotPetyaFootnote 6, the compromising of chrome extentionsFootnote 7, and the ShadowPad backdoorFootnote 8. Thereby, extra steps must be taken to evaluate the authenticity of software/hardware updates. That being said, software updates are still an important defense against attacks, and therefore cannot be ignored to stop supply chain attacks as it would in turn provide attackers with vulnerabilities they can exploit to penetrate the architecture. As the results show with a poor patching strategy and the absence of passive/active monitoring (IDS/IPS), given enough time, attackers can navigate in any direction, one example is from the smart meter all the way to the SCADA server. Forcing malicious parties to discover zero days is compulsory for a decently secure architecture.
The general takeaway defense-wise is that it is of the utmost importance to increase efforts in securing the smart Grid, in all the ways possible, as they appear to be generally complementary. Having a DMZ to separate sensitive networks such as the SCADA zone from open, potentially compromised network (the internet) is necessary (i.e network segmentation). However, without a good patching strategy, a well defined access control and firewalls, and security aware employees, a DMZ constitutes an extra barrier for the attacker, but does not make it hard enough for the attacker. The opposite situation is also true, with good security defences but a shorter path to the sensitive, critical hosts. Nonetheless, it does appear that strong security measures provide a better protection in general, if taken into account that the attacker can hide in many different zones of the smart Grid IT infrastructure; strong security measures are particularly efficient when the attack path requires many steps.
That being said, there is no silver bullet available. The smart grid remains a network of IT/OT machines, with dataflows going between them. Results show that a group of state-sponsored hackers, given enough time and regardless of the defences in place (according to the current state of the art), will eventually make its way into a critical infrastructure such as the smart grid. To mitigate this threat, it is highly recommended to increase security defences and mechanisms (such as patching, hardened hosts, strong and systematic access control, but also IDS/IPS, etc) as well as reducing to the minimum the possibilities for interactions between sensitive, critical hosts and exposed hosts from more open networks. Mitigations won’t eliminate the threats, but they will increase the cyber resilience of the infrastructure by increasing both its time frame and effectiveness. In a time where usability, efficiency and practicality are at the front of every domain, these aspects should really be thought through with stronger security assessments before allowing, for instance, remote access of SCADA HMIs from Office networks.
7 Conclusions and Future Work
In this paper we present a cyber security evaluation of the ICT part of the smart grid, with a focus on load balancing of renewable energy. First by designing a reference architecture model and thereafter using a threat modelling approach and a set of attack graphs representing expert knowledge, encapsulated in a tool called securiCAD. The reference architecture model was carefully designed, over many iterations, with the help of a consortium of experts who listed all the important dataflows of the smart grid to achieve load balancing of renewable energy. Moreover, the model comes in four variants, each representing a particular configuration of the infrastructure in terms of security measures, allowing an effective cyber security comparison of the variants depending on the initial starting point of the attacker.
Analysis results show that the critical nature of SCADA infrastructures and the sensitive physical systems they control (e.g., the power grid), together with the two-way communication flows on public channels (e.g., the internet) with remote systems owned by other stakeholders, rise concerns whether the architecture of the smart grid still remains satisfactory in today’s state of the cyberspace and the increased presence and sophistication of cyber threats. Currently, SCADA systems tend to be highly sensitive to even short performance degradation of the networks and computers on which they run (Langner 2011), which makes the application of active security countermeasures difficult and risky. Our findings, in line with (Langner 2011), suggest that there is a need to make today’s SCADA infrastructures with their hardware and software constituents, and the entire ICT part of the smart grid in general, more inherently secure and more robust (thereby more tolerant to different security solutions functioning on the same networks, and perhaps even on the same devices and operating systems).
The general takeaway for an increased cyber security resilience of the smart grid is that the various protection mechanisms appear to be generally complementary. Having a DMZ to separate sensitive networks such as the SCADA zone from open, potentially compromised, networks (the internet) makes attacks much more difficult (if the threat comes from the internet). However, if the attacker can find another entry point of attack, the DMZ becomes obsolete and instead a good patching strategy, well defined access control and firewalls, and security-aware employees are necessary to increase protection. In other words, reaching 100% protection is not a realistic goal because of the infinite ways to bypass, subvert, or disable systems accepting data input. What can and should be done however is to make the attacker’s attack path longer, with each of the steps harder and more cumbersome to pass. Unfortunately, although the approach of frequently patching systems is necessary, especially against the more sophisticated attackers, it also appears to be very difficult to implement (to this date). Much harder than improving the infrastructure with an additional DMZ, for instance.
Our analysis is focused on load balancing of renewable energy, an important feature of the smart grid. Still, there are many other features that need to be analyzed and potentially compared with each other. As future work, we plan to investigate cyber security in other features, for instance dynamic power management for smart homes, smart offices, electric vehicles, and automatic reconfiguration of the smart grid, reusing parts of the reference architecture model presented in this paper.
8 Appendix
Notes
Abbreviations
- AMI:
-
Advanced metering infrastructure
- CNNVD:
-
China national vulnerability database of information security
- CySeMoL:
-
Cyber security modeling language
- DE:
-
Data engineering
- DER:
-
Distributed energy resource
- DLMS:
-
IEC 62056 protocol
- DMZ:
-
Demilitarized zone
- DSO:
-
Distribution system operator
- EMS:
-
Energy management system
- FE:
-
Front end
- FK:
-
Meter firmware and key server
- GERA:
-
Generalized enterprise reference architecture
- GERAM:
-
Generalised enterprise reference architecture and methodology
- GPRS:
-
General packet radio service
- GSM:
-
Global system for mobile communications
- HES:
-
Head end system
- HMI:
-
Human machine interface
- HV:
-
High voltage
- ICT:
-
Information and communications technology
- IDS:
-
Intrusion detection system
- IED:
-
Intelligent electronic device
- IPS:
-
Intrusion prevention system
- LAN:
-
Local area network
- LDAP:
-
Lightweight directory access protocol
- LTE:
-
4G mobile communications standard
- LV:
-
Low voltage
- MV:
-
Medium voltage
- NVD:
-
National vulnerability database
- OT:
-
Operational technology
- PEM:
-
Partial enterprise model
- PLC:
-
Power line carrier
- RTU:
-
Remote terminal unit
- SA:
-
Substation automation
- SCADA:
-
Supervisory control and data acquisition
- SFTP:
-
Secure file transfer protocol
- SGAM:
-
Smart grid architecture model
- SSH:
-
Secure shell
- TSO:
-
Transmission system operator
- TTC:
-
Time-to-compromise
- VPN:
-
Virtual private network
- WAN:
-
Wide area network
References
Alberts, C, Dorofee A, Stevens J, Woody C (2003) Introduction to the octave approach. Technical report.
Angelov, S, Grefen P, Greefhorst D (2009) A classification of software reference architectures: Analyzing their success and effectiveness In: Software Architecture, 2009 & European Conference on Software Architecture. WICSA/ECSA 2009. Joint Working IEEE/IFIP Conference On, 141–150.. IEEE, New York.
Bernus, P, Nemes L, Schmidt GJ (2012) Handbook on Enterprise Architecture. Springer, Berlin Heidelberg.
Bernus, P, Noran O (2010) A Metamodel for Enterprise Architecture. In: Bernus P, Doumeingts G, Fox M (eds)Enterprise Architecture, Integration and Interoperability, 56–65.. Springer, Berlin, Heidelberg.
Blom, R, Korman M, Lagerström R, Ekstedt M (2016) Analyzing attack resilience of an advanced meter infrastructure reference model In: Cyber-Physical Security and Resilience in Smart Grids (CPSR-SG), Joint Workshop On, 1–6.. IEEE, New York.
Boyer, SA (2009) SCADA: Supervisory Control and Data Acquisition. International Society of Automation.
Breu, R, Innerhofer-Oberperfler F, Yautsiukhin A (2008) Quantitative assessment of enterprise security system In: Availability, Reliability and Security, 2008. ARES 08. Third International Conference On, 921–928.. IEEE, New York.
Cherdantseva, Y, Burnap P, Blyth A, Eden P, Jones K, Soulsby H, Stoddart K (2016) A review of cyber security risk assessment methods for scada systems. Comput Secur 56:1–27.
Cloutier, R, Muller G, Verma D, Nilchiani R, Hole E, Bone M (2010) The concept of reference architectures. Syst Eng 13(1):14–27.
Corp, S (2018) Risk Analytics for Cyber Security, Skybox Security. http://www.skyboxsecurity.com/. Accessed 15 Jan 2018.
Ekstedt, M, Franke U, Johnson P, Lagerström R, Sommestad T, Ullberg J, Buschle M (2009) A tool for enterprise architecture analysis of maintainability In: Software Maintenance and Reengineering, 2009. CSMR’09. 13th European Conference On, 327–328.. IEEE, New York.
Ekstedt, M, Johnson P, Lagerström R, Gorton D, Nydrén J, Shahzad K (2015) securicad by foreseeti: A cad tool for enterprise cyber security management In: Enterprise Distributed Object Computing Workshop (EDOCW), 2015 IEEE 19th International, 152–155.. IEEE, New York.
foreseeti (2018) securiCAD, Cyber Threat Modelling and Risk Management. https://www.foreseeti.com/. Accessed 15 Jan 2018.
Galster, M, Avgeriou P (2011) Empirically-grounded reference architectures: a proposal In: Proceedings of the Joint ACM SIGSOFT conference–QoSA and ACM SIGSOFT symposium–ISARCS on Quality of Software architectures–QoSA and Architecting Critical systems–ISARCS, 153–158.. ACM, New York.
Gottschalk, M, Uslar M, Delfs C (2017) The Use Case and Smart Grid Architecture Model Approach: The IEC 62559-2 Use Case Template and the SGAM Applied in Various Domains. Springer, Berlin Heidelberg.
Group, C-C-ESGCCEN-CENELEC-ETSI Smart Grid Coordination Group: Smart Grid Reference Architecture. ftp://ftp.cencenelec.eu/EN/EuropeanStandardization/HotTopics/SmartGrids/Reference_Architecture_final.pdf.
Holm, H (2014) A large-scale study of the time required to compromise a computer system. Dependable Secure Comput IEEE Trans 11(1):2–15.
Holm, H, Buschle M, Lagerström R, Ekstedt M (2014) Automatic data collection for enterprise architecture models. Softw Syst Model 13(2):825–841.
Holm, H, Shahzad K, Buschle M, Ekstedt M (2015) P2CySeMoL: Predictive, Probabilistic Cyber Security Modeling Language. IEEE Trans Dependable Secure Comput 12:626–639.
Holm, H, Sommestad T, Ekstedt M, Nordström L (2013) Cysemol: A tool for cyber security analysis of enterprises In: Electricity Distribution (CIRED 2013), 22nd International Conference and Exhibition On, 1–4.. IET, Mississauga.
Huang, H, Zhang S, Ou X, Prakash A, Sakallah K (2011) Distilling critical attack graph surface iteratively through minimum-cost sat solving In: Proceedings of the 27th Annual Computer Security Applications Conference, 31–40.. ACM, New York.
Inc, R (2018) RedSeal Systems. https://redseal.net/. Accessed 15 Jan 2018.
Irlbeck, M, Bytschkow D, Hackenberg G, Koutsoumpas V (2013) Towards a bottom-up development of reference architectures for smart energy systems In: Software Engineering Challenges for the Smart Grid (SE4SG), 2013 2nd International Workshop On, 9–16.. IEEE, New York.
Jauhar, S, Chen B, Temple WG, Dong X, Kalbarczyk Z, Sanders WH, Nicol DM (2015) Model-based cybersecurity assessment with nescor smart grid failure scenarios In: Dependable Computing (PRDC), 2015 IEEE 21st Pacific Rim International Symposium On, 319–324.. IEEE, New York.
Johnson, P, Vernotte A, Ekstedt M, Lagerström R (2016) pwnpr3d: an attack-graph-driven probabilistic threat-modeling approach In: Availability, Reliability and Security (ARES), 2016 11th International Conference On, 278–283.. IEEE, New York.
Jonsson, E, Olovsson T (1997) A quantitative model of the security intrusion process based on attacker behavior. Softw Eng IEEE Trans 23(4):235–245.
Ingols, K, Chu M, Lippmann R, Webster S, Boyer S (2009) Modeling modern network attacks and countermeasures using attack graphs In: Computer Security Applications Conference, 2009. ACSAC’09. Annual, 117–126.. IEEE, New York.
Institute, EPRAnalysis of Selected Electric Sector High Risk Failure Scenarios. http://smartgrid.epri.com/doc/nescor%20detailed%20failure%20scenarios%2009-13%20final.pdf.
Johnson, P, Lagerström R, Närman P, Simonsson M (2007) Extended influence diagrams for system quality analysis. J Softw 2(3):30–42.
Jajodia, S, Noel S, O’Berry B (2005) Topological analysis of network attack vulnerability In: Managing Cyber Threats, 247–266.. Springer, Berlin Heidelberg.
Korman, M, Lagerström R, Välja M, Ekstedt M, Blom R (2016) Technology management through architecture reference models: A smart metering case In: Management of Engineering and Technology (PICMET), 2016 Portland International Conference On, 2338–2350.. IEEE, New York.
Korman, M, Välja M, Björkman G, Ekstedt M, Vernotte A, Lagerström R (2017) Analyzing the effectiveness of attack countermeasures in a scada system In: Proceedings of the 2nd Workshop on Cyber-Physical Security and Resilience in Smart Grids, 73–78.. ACM, New York.
Lagerström, R, Baldwin C, MacCormack A, Dreyfus D (2013) Visualizing and measuring enterprise architecture: an exploratory biopharma case In: IFIP Working Conference on The Practice of Enterprise Modeling, 9–23.. Springer, Berlin Heidelberg.
Lagerstrom, R, Sommestad T, Buschle M, Ekstedt M (2011) Enterprise architecture management’s impact on information technology success In: System Sciences (HICSS), 2011 44th Hawaii International Conference On, 1–10.. IEEE, New York.
Langner, R (2011) Stuxnet: Dissecting a cyberwarfare weapon. IEEE Secur Priv 9(3):49–51.
Lee, RM, Assante MJ, Conway T (2016) Analysis of the cyber attack on the Ukrainian power grid. SANS Industrial Control Systems. https://ics.sans.org/media/E-ISAC_SANS_Ukraine_DUC_5.pdf.
LeMay, E, Ford MD, Keefe K, Sanders WH, Muehrcke C (2011) Model-based Security Metrics Using ADversary VIew Security Evaluation (ADVISE) In: 2011 Eighth International Conference on Quantitative Evaluation of SysTems, 191–200.. IEEE, New York. http://dx.doi.org/10.1109/QEST.2011.34.
Lund, MS, Solhaug B, Stølen K (2010) Model-driven Risk Analysis: the CORAS Approach. Springer, Berlin Heidelberg.
Närman, P, Johnson P, Lagerström R, Franke U, Ekstedt M (2009) Data Collection Prioritization for System Quality Analysis. Electronic Notes in Theoretical Computer Science. Elsevier. New York, NY, US. 233:29–42. Proceedings of the International Workshop on Software Quality and Maintainability (SQM 2008). https://doi.org/10.1016/j.entcs.2009.02.059, http://www.sciencedirect.com/science/article/pii/S1571066109000644.
Nakagawa, EY, Oquendo F, Becker M (2012) Ramodel: A reference model for reference architectures In: Software Architecture (WICSA) and European Conference on Software Architecture (ECSA), 2012 Joint Working IEEE/IFIP Conference On, 297–301.. IEEE, New York.
Ou, X, Boyer WF, McQueen MA (2006) A scalable approach to attack graph generation In: Proceedings of the 13th ACM Conference on Computer and Communications Security, 336–345.. ACM, New York.
Ou, X, Singhal A (2012) Quantitative Security Risk Assessment of Enterprise Networks. Springer, Berlin Heidelberg.
Padilla, E (2015) Substation Automation Systems: Design and Implementation. John Wiley & Sons.
Santodomingo, R, Uslar M, Goring A, Gottschalk M, Nordstrom L, Saleem A, Chenine M (2014) Sgam-based methodology to analyse smart grid solutions in discern european research project In: Energy Conference (ENERGYCON), 2014 IEEE International, 751–758.. IEEE, New York.
Searle, J, Rasche G, Wright A, Dinnage SNESCOR Guide to Penetration Testing For Electric Utilities. http://smartgrid.epri.com/doc/NESCORGuidetoPenetrationTestingforElectricUtilities-v3-Final.pdf.
Smart Grid Interoperability Panel – Smart Grid Cybersecurity CommitteeNISTIR 7628 Revision 1 - Guidelines for Smart Grid Cyber Security, Vol. 1-3. http://nvlpubs.nist.gov/nistpubs/ir/2014/NIST.IR.7628r1.pdf.
Sommestad, T, Ekstedt M, Holm H (2013) The Cyber Security Modeling Language: A Tool for Assessing the Vulnerability of Enterprise System Architectures. Syst J IEEE, New York 7(3):363–373.
Sommestad, T, Ekstedt M, Johnson P (2009) Cyber security risks assessment with bayesian defense graphs and architectural models In: System Sciences, 2009. HICSS’09. 42nd Hawaii International Conference On, 1–10.. IEEE.
Trefke, J, Rohjans S, Uslar M, Lehnhoff S, Nordstrom L, Saleem A (2013) Smart grid architecture model use case management in a large european smart grid project In: Innovative Smart Grid Technologies Europe (ISGT EUROPE), 2013 4th IEEE/PES, 1–5.. IEEE, New York.
Uslar, M, Rosinger C, Schlegel S (2014) Security by design for the smart grid: Combining the sgam and nistir 7628 In: Computer Software and Applications Conference Workshops (COMPSACW), 2014 IEEE 38th International, 110–115.. IEEE, New York.
Välja, M, Korman M, Lagerström R, Franke U, Ekstedt M (2016) Automated architecture modeling for enterprise technology manageme using principles from data fusion: A security analysis case In: Management of Engineering and Technology (PICMET), 2016 Portland International Conference On, 14–22.. IEEE, New York.
Vu, AH, Tippenhauer NO, Chen B, Nicol DM, Kalbarczyk Z (2014) Cybersage: A tool for automatic security assessment of cyber-physical systems In: Quantitative Evaluation of Systems.. Springer, Berlin Heidelberg.
Wang, AJA (2005) Information security models and metrics In: Proceedings of the 43rd Annual Southeast Regional conference-Volume 2, 178–184.. ACM.
Wenpeng, L (2009) Advanced metering infrastructure. South Power Syst Technol 3(2):6–10.
Acknowledgements
We thank the consortium of experts from ABB, Alliander and EDP for helping us draw a list of dataflows that allowed us to design the reference architecture model.
Funding
This work has received funding from the EU FP7 under grand agreement no. 607109 (SEGRID), Swedish Centre for Smart Grids and Energy Storage (SweGRIDS), the Swedish National Grid, as well as the Swedish Civil Contingencies Agency through the research centre Resilient Information and Control Systems (RICS).
Availability of data and materials
The list of dataflows as well as the defense configuration settings are submitted separately in the Appendix.
Author information
Authors and Affiliations
Contributions
The authors divided the work as follows: AV Gathering data, creating models, models analysis, paper writing and reviewing. MV Gathering data, contributing to creating models, paper writing and reviewing. MK Gathering data, contributing to creating models, contributing to analysis, paper writing. GB Consultant in data gathering and the creation of models, paper writing and reviewing. ME Research project idea, research methodology, model reviewing, and paper reviewing. RL research project idea, research methodology, paper writing and reviewing. All authors read and approved the final manuscript.
Corresponding author
Ethics declarations
Competing interests
We do not see any competing interest as of now.
Publisher’s Note
Springer Nature remains neutral with regard to jurisdictional claims in published maps and institutional affiliations.
Rights and permissions
Open Access This article is distributed under the terms of the Creative Commons Attribution 4.0 International License (http://creativecommons.org/licenses/by/4.0/), which permits unrestricted use, distribution, and reproduction in any medium, provided you give appropriate credit to the original author(s) and the source, provide a link to the Creative Commons license, and indicate if changes were made.
About this article

Cite this article
Vernotte, A., Välja, M., Korman, M. et al. Load balancing of renewable energy: a cyber security analysis. Energy Inform 1, 5 (2018). https://doi.org/10.1186/s42162-018-0010-x
Received:
Accepted:
Published:
DOI: https://doi.org/10.1186/s42162-018-0010-x