- Research
- Open access
- Published:
Electric vehicles as distribution grid batteries: a reality check
Energy Informatics volume 4, Article number: 29 (2021)
Abstract
The current transition towards electric mobility implies that a significant portion of electricity is drawn by and stored in the electric vehicle’s (EV) batteries. Vehicle-to-grid (V2G) technologies can potentially give distribution system operators access to such energy to provide ancillary services, while remunerating the vehicle owners for their availability to participate. Although the benefits of stabilization and grid efficiency improvements are clear, is it appealing and lucrative for the vehicle owners to participate in such services? In this work, we answer this question by modelling the V2G system and performing economic projections of the possible benefits for EV owners. In particular, we present a novel way of parametrizing the electric vehicle driving profile and the V2G energy transfer to compute battery degradation costs. A profit model is developed to evaluate the profit earned by the vehicle owners offering their batteries. The profit is estimated on the basis of the owner’s inclination to buy and sell energy from the grid based on the electricity price. Using data of the German electricity market, we estimate a profit of 662 €/EV/Year for a vehicle with 100 kWh capacity, 95% battery round trip efficiency and driving 52 km per day. The remuneration is meaningful and can have the potential to encourage EV owners to participate in V2G service.
Introduction
The global “Energy Transition” envisions a gradual but complete moving from fossil to sustainable sources (German Federal Ministry for Economic Affairs and Energy (BMWi), 2019a). Germany is at the forefront of such transition and one of the prominent players in the European energy market. With the deadline set to phase out nuclear energy by 2022 (German Federal Ministry for Economic Affairs and Energy (BMWi), 2019a), Germany will have to rely on Renewable Energy Sources (RES) to meet its energy requirements. In 2018, 37.8% of electricity consumed by Germany was produced from RES (German Federal Ministry for Economic Affairs and Energy (BMWi), 2019b). Since the power output from RES depends on the weather conditions and the geographical location, the uncertainty is high, in turn hindering overall reliability. In order to mitigate the fluctuations in RES power output, robust, decentralized, and intermittent power sources are required. Currently most of the energy markets use traditional ancillary services to overcome imbalance on the grid (Raineri et al., 2006). Recently, several authors have proposed the integration of EVs’ batteries as flexible storage for the distribution grid (Mwasilu et al., 2014; Kamboj et al., 2011; Madawala & Thrimawithana, 2011). The main advantage of such Vehicle-to-grid (V2G) interactions is the accommodation of the uncertainties and fluctuations of RES. V2G can also provide grid ancillary services like black-start capability, frequency and voltage regulation.
EVs can act as a distributed source of energy reducing the transportation and maintenance cost for the Distribution System Operators (DSO). Recently V2G has gained traction again due to the decreasing cost and increasing capacity of the EV batteries. The cost of EV batteries have dropped from 1000 $/kWh in 2010 to 273 $/kWh in 2016 and the downward trend continues (Curry, 2017). The capacity of the modern day EV battery is up to 100 kWh (Iclodean et al., 2017) and most of the EVs are not utilized for 95% of the time (Barter, 2013). According to the International Energy Agency, the estimated number of EVs will be 250 Million by 2030 (IEA, 2019). With this vast amount of electric energy drawn and stored in EVs, V2G will have a central role in the future energy markets. There are two ways in which EVs can participate in V2G services. The first one is the V2G energy arbitrage where EVs sell the excess energy to the grid when the electricity price is considered high. And, the EV buys electricity from the grid when the electricity price is low. The second way is the V2G ancillary service. Here, the EV discharges or charges the energy to or from the grid to maintain a constant grid frequency. Despite its multi-functional applications, V2G has not been implemented beyond limited proof of concepts (Kester et al., 2018). While research on the topic has considerably increased, there are still technical and social-economical challenges to be addressed.
State of the art
The authors of (Almehizia & Snodgrass, 2018) determine that using V2G technology to sell electricity to the grid is profitable. Based on USA data, Peterson et al. model the economic and net social welfare benefits of V2G participation at off-peak hours (Peterson et al., 2010). They conclude that the savings are too small to encourage user participation. Kiaee et al. show that the charging cost of the EV can be reduced by participating in V2G schemes (Kiaee et al., 2015). Uddin et al. prove that the battery life of an EV can be extended by participating in V2G service (Uddin et al., 2017) by discharging the EV battery to lower State Of Charge (SOC) under constraints. Finally, Latini et al. show that the V2G ancillary services are profitable in the Italian market (Latini et al., 2019). We compare the first four of these studies in terms of their assumptions and expected profit for the owner, as shown in Table 1. For the fifth study this was not possible due to the available data.
The previous studies assume a technical need for V2G interaction and provide economic models and analyses. Though a number of important factors were not considered. The first factor is the inevitable battery degradation caused by V2G services. An exception is in (Almehizia & Snodgrass, 2018), where a fixed battery degradation cost is considered for the calculation of the profit. Though a fixed degradation cost is an important simplification. Furthermore, the economic feasibility of V2G depends on the market regulation and the remuneration schemes. Analysis done for a specific market cannot be applied to the others. Hence, each of the energy markets have to be analysed individually. Finally, vehicles are, in most cases, privately owned and independent of the distribution system operator. This means that involving them in the grid can only happen on a voluntary basis. The will to participate therefore must come from an incentive. The most obvious one is an economic one. Therefore, the question arises: Is the possible remuneration to the vehicle owner for participating in the vehicle to grid scheme significant, if at all positive?
Contribution and organization
The present work addresses the question from an economic point of view, using actual market values from the German electricity market and using a model as close as possible to the physical system. Most notably, the economic feasibility of V2G energy arbitrage considers a dynamic battery degradation model. The study is purely techno-economical and does not consider psychological effects of incentives. For instance, a sustainability-based incentive that rewards EV users for their societal involvement and their level of greenness in non-monetary terms might be more effective than economic incentives. Such non-technical consideration, while very important, are considered outside the scope of the paper.
The core contribution of the present work is that of quantifying economically what the possible return for an EV owner is for participating in an energy distribution market and offering V2G services. For such quantification, a dynamic battery energy model is used to estimate the battery degradation from the V2G energy arbitrage. We remark that the battery degradation model is from the state of the art in the field (Xu et al., 2016); what the present work contributes is a novel way of translating EV driving profiles and V2G energy transactions into battery degradation values. Finally, a simulation based on the given model, battery costs and actual energy market data from Germany is presented.
The remainder of the paper is organized into four sections. Section 2 introduces the model and illustrates the methodology used for the profit calculation. Section 3 gives the description of the case study and the setup and running of the simulations. Section 4 presents and analyzes the results of the simulations. A discussion of the results and general conclusions are offered in Section 5.
Methodology
Profit is the financial gain defined as the difference between the amount earned and the amount spent. Revenue is the income generated by the sale of goods or services. During the V2G energy arbitrage, the revenue earned is the amount paid to the EV owner for the electric energy discharged (sold) to the grid. Neglecting the infrastructure and the maintenance cost, profit is the difference between the revenue and the cost incurred by the EV owner for charging the EV battery and battery degradation cost. To improve the accuracy of the profit estimation one must consider the actual electricity price signal from the target market. The battery degradation cost is estimated by considering a dynamic battery degradation model. The factors which affect the profit from V2G energy arbitrage are parameterized and given as input to the profit model.
Profit model
Revenue generated from V2G energy arbitrage depends on the capacity of the EV battery and its efficiency, in addition to the electricity price, more formally:
where M is the number of discharge events; Nm is the duration of discharge in hours corresponding to a discharge event m; ∆SOC dism is the percentage of EV battery capacity discharged to the grid corresponding to a discharge event m; p(n) is the selling price of the electricity for the corresponding hour n in Euros/kWh; discharge_eff is the battery discharge efficiency; and battery_capacity is the total capacity of the battery in kWh.
The charging cost is driven by the price at a given moment taking into account the small battery losses in the charging process, that is:
where M is the number of charge events; Nm is the duration of charge in hours corresponding to a charge event m; ∆SOC_chargem is the percentage of EV battery capacity charged from the grid to the EV for the corresponding charge event m; p(n) is the buying price of the electricity for the corresponding hour n in Euros/kWh; charge_eff is the battery charge efficiency which is the square root of the round trip efficiency; and battery_capacity is the total capacity of the battery in kWh.
The profit is the difference between the revenue and the cost incurred by the EV owner for charging the EV battery and battery degradation cost. To calculate the charging cost due to V2G energy arbitrage, first we calculate the charging cost (costv2g) incurred when the vehicle participates in V2G energy arbitrage. The costv2g includes the charging cost for driving the vehicle and V2G energy arbitrage. Second, we calculate the charging cost (costnv2g) incurred when the vehicle does not participate in V2G energy arbitrage. The costnv2g calculates the charging cost only due to the driving. The difference between these two gives the charging cost which is due to V2G energy arbitrage. Similarly, the battery_deg_costv2g is the battery degradation cost including driving and V2G energy arbitrage. The battery_deg_costnv2g is the battery degradation cost only due to vehicle driving. The difference between battery_deg_costv2g and battery_deg_costnv2g gives the battery degradation cost which is only due to the V2G energy arbitrage. The profit can be calculated as:
where revenuev2g is the revenue to the EV owner when EV participates in the V2G service from Eq. (1). With the eq. (3) the battery degradation and the charging cost due to EV driving is eliminated and the accuracy of the estimated profit is increased. The profit without considering the battery degradation cost can be calculated as per the Eq. (4). The value is helpful to evaluate the impact of battery degradation cost due to V2G energy arbitrage.
The battery degradation cost is calculated by Eq. (5). The equation is adapted from the one used in (Peterson et al., 2010):
where battery_replacement_cost is the cost of replacing the degraded battery with a new one; and battery_degradation is the amount of degradation given by the battery degradation model. The battery_degradation can take values from 0 to 0.2. The factor 0.2 is considered because most of the commercial EV battery’s End Of Life (EOL) is reached, when the battery loses 20% of its initial capacity (Fernández et al., 2013). The battery degradation is estimated by the dynamic battery degradation model explained in the next section.
In order to increase the efficiency of the profit model, the factors which affect the profit are parameterized. This enables the model to represent actual scenarios effectively. The parameters for the profit model are:
-
Price signal (€/kWh): Electricity price signal of the target energy market.
The profit is highly dependent on difference between buying and selling price.
-
Battery capacity (kWh): Capacity of the EV battery. The batteries with high capacity have higher residual energy available for energy arbitrage.
-
Round trip efficiency: Denotes the share of energy that can be successfully stored into or retrieved back from the battery.
-
Battery replacement cost (€): Cost of replacing the degraded battery with a new one.
-
EV driving distance (km/day): Denotes the usage of the EV battery for driving the vehicle. Shorter driving distance results in increased availability of energy for V2G energy arbitrage.
-
Maximum charge capacity (% of the battery capacity): Maximum amount of charge that can be put into the EV battery during energy arbitrage.
-
Battery discharge threshold (% of the battery capacity): The minimum remaining charge that has to be maintained at all times in the EV battery during energy arbitrage. This charge is used for emergency and unplanned travel.
Several scenarios can be represented by varying the above parameters which, in turn, are derived from actual EV driving patterns. A “driving pattern” is a graph of the state of an EV vehicle (discharging, charging or idle) with respect to time. Driving is part of discharging. The pattern is used to calculate the profit model flexibility depending on the specific use cases and EV owner’s requirements.
The charging and discharging scheme used for V2G energy arbitrage plays a huge role in increasing the profit. The simplest method is to discharge to the grid when the selling price is high and charge the EV when the buying price is low. However, this scheme is not efficient as it does not take the battery degradation into account. In the proposed profit model, the charge/discharge scheme calculates the profit due to different charge or discharge timings taking into account the corresponding battery degradation. The charge or discharge timing which results in the maximum profit is selected by the profit model for the profit calculation.
Battery degradation model
The battery degradation model encompasses parameters like temperature, State Of Charge (SOC), Depth of Discharge (DOD), Charging rate (C-rate), time, and the accumulated battery degradation. SOC denotes the amount of energy remaining in the battery. DOD indicates the percentage of energy taken out of the battery. C-rate denotes the rate at which the charge and discharge takes place. We use the battery degradation model from (Xu et al., 2016). This model is chosen for the following reasons. It considers temperature, SOC, DOD, time, and the accumulated battery degradation to estimate the current battery degradation. It supports the widely used battery type Lithium Manganese Oxide (LMO). It gives the incremental degradation due to specific charge or discharge events and allows configuring the parameters for each of the events. Hence it serves as a dynamic battery degradation estimation model which is desired for this work. However, the model has the following limitations: it does not consider C-rate dependency on degradation and the temperature dependency is not valid below 15 degrees Celsius. In spite of these two limitations, the model makes valid estimations of battery degradation. Formally, in the model battery degradation is given by:
where L is the degraded battery capacity after the charge/discharge event; L’ is the current degradation of the battery; and fd are the degradation components due to the EV’s state (e.g., EV is idle) and cycle aging (during charge or discharge). The fd is defined as:
where fcyc and fcal are the cyclic and calendar aging components, respectively. Cycle aging and calendar aging occur in parallel:
where DOD is the depth of charge for the cycle; SOCavg is the average SOC during the cycle; Tavg is the average temperature during the cycle; N is the number of cycles; t is the duration of the cycle; and n is a half or full-cycle factor. The individual stress factors fDOD, fSOC, and fT are given by the following equations:
where kt is a constant; t is the duration for which calendar aging is being calculated; SOC is the SOC at with the battery is idle for the time t; and T is the temperature of the battery during the calendar aging.
where kDOD1, kDOD2 and kDOD3 are constants, given in Table 2.
where kSOC and SOCref are constants.
with kT a constant; and Tref the Reference Temperature constant. The authors of (Xu et al., 2016) have derived the constants in the battery degradation equations based on curve fitting techniques. The constant coefficients derived for this model are listed in Table 2. In the following simulation, the temperature is assumed to remain constant at the temperature of 28 degrees when the EV is driven, and at a constant temperature of 25 degrees when the EV is parked. Since the assumed temperatures are above the lower limit of the battery degradation model used (Xu et al., 2016), the limitations of the battery degradation model are not violated.
Simulations
The profit from the V2G energy arbitrage depends on several factors such as energy policy, EV battery, driving profile, battery capacity, battery chemistry and others. The more specific the assumptions are regarding these factors, the more realistic the profit values will be. In the present work, the profit due to energy arbitrage is calculated for the German energy market. Following are the assumptions made to derive the German case.
Assumptions
-
1.
The driving patterns of the EV are fixed. The EV is fully charged from 23:00 h to 07:00 h, driven to office from 07:00 h to 08:00 h, parked at office till 17:00 h, driven back home from 17:00 h to 18:00 h and parked at home till 23:00 h.
-
2.
The V2G energy arbitrage takes place only at the office from 08:00 h to 17:00 h. Ideally V2G can take place even after 17:00 h. Since, the SOC of the EV is already low when the EV arrives home, the possibility of V2G discharge event at home is less.
-
3.
Only a discharge event or a discharge event followed by a charge event is possible in the span of V2G energy arbitrage. Each charge or discharge event lasts for one hour.
-
4.
The charging and discharging current rate is assumed to remain constant during the V2G event.
-
5.
The price signals from the German day ahead electricity market of 2019 are considered for the profit estimation. Since Germany does not have dual tariff prices, the selling and buying price of electricity is assumed to be the same at any instant to simulate the dual tariff.
Driving patterns
A predictable driving behaviour is observed in EV owners, who work at an office location five days a week. The driving pattern chosen for this model is similar to the one put forth by the authors of (Zhaoxi et al., 2015) and shown in Fig. 1. We refer to the time frame in which V2G transaction can take place as “V2G window”. In the V2G window, the EV can either charge from or discharge to the grid. The maximum charging limit is 100% of the battery capacity and the minimum remaining capacity at any point of time is 10%. 10% of the capacity is set as a threshold to fulfil the need for unforeseen and emergency travel. The principle “sell before buy” which was considered in (Peterson et al., 2010) is used in this model. The “sell before buy” principle implies that EV always discharges to the minimum remaining capacity (10%) before charging the battery in the V2G window. The minimum remaining capacity is referred to as “battery discharge threshold”.
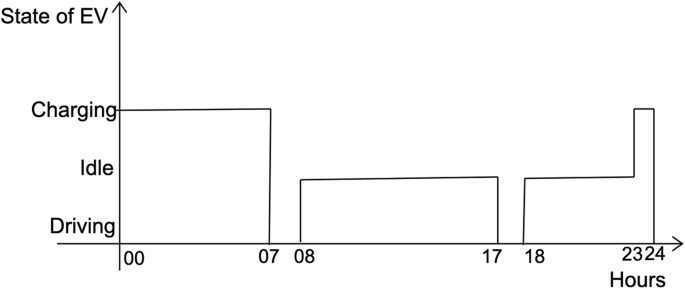
EV driving pattern in a day
With these assumptions, there are three distinct scenarios on how V2G energy arbitrage can occur:
-
1.
No V2G: No charge or discharge event occurs in the V2G window, as shown in Fig. 2. This case represents the situation where EV provides no V2G energy arbitrage.
-
2.
V2G discharge only: Only one discharge event in the V2G window, as shown in Fig. 3. Here, EV can only discharge to the grid but cannot charge from the grid.
-
3.
V2G discharge and charge: A discharge event followed by a charge event in the V2G window, as shown in Fig. 4. Here, EV can charge from and discharge to the grid.

SOC profile of an EV with no V2G service

SOC profile of an EV with one V2G discharge event

SOC profile of an EV with a V2G discharge followed by charge event
The charging event is required in the third case to make sure the EV has enough battery charge to drive back home. Within these cases, there are multiple V2G possibilities depending on when the charge or discharge events occur. The EV can immediately discharge to the grid after connecting or be idle for some time and then discharge. There is only one case for the No V2G scenario as there are no charge or discharge events. To assess all the possible cases for the other two scenarios, time variables are used to generate different combinations. The V2G discharge only scenario has two variables ‘a’ and ‘c’ which vary and ‘b’ is fixed to 1 as the discharge to the grid will always be done for an hour. Figure 3 illustrates the timing variables for the V2G discharge only scenario. For varying values of ‘a’ and ‘c’ there will be a unique V2G profile. The V2G discharge and charge scenario has three variables ‘a’, ‘c’ and ‘e’ and two fixed values ‘b’ and ‘d’ set to 1. Figure 4 illustrates the timing variables for this scenario. There will be a unique V2G profile for different values of ‘a’, ‘c’ and ‘e’. Since the V2G window is fixed, the sum of all variables should be equal to the V2G window. The possible number of V2G profiles in each scenario is shown in Table 3.
Profit model simulation
The input parameters for the profit model are chosen in accordance to actual scenarios. The price signal of the German market for a number of days is given as input to the model. The model uses the single day price with one hour resolution for each day. The model creates the SOC profile based on the timings in Table 3. Based on the SOC profile, the model separates the charge and discharge events and calculates the amount of energy transferred during each event.
The energy transferred is calculated based on the EV driving distance, SOC of the battery, and battery discharge threshold. The model employs the battery degradation model to give the amount of battery degradation for a specific SOC profile. The battery degradation model is used for the battery degradation computation according to the SOC profile, in turn giving the amount of degradation for the profit model. Finally, the profit is calculated with Eq. (3). Algorithm 1 lists the procedure used to determine the profit for a number of days for a specific EV and driving pattern. The simulation is illustrated next, for details we refer to (Malya, 2020).
Algorithm 1
Profit with battery degradation.
1: procedure PROFIT (price_signal).
2: Initialize the input parameters.
3: Generate the V2G profiles.
4: for Number of profiles do.
5: calculate the degradation cost per day
6: for Number of days do.
7: for Number of profiles do.
8: Calculate profit as per the Eq. (3) with the battery degradation costs calculated in Step 5.
9: for Number of days do.
10: Select the profile which gives the highest profit, Step 8.
11: Accumulate the profit without degradation using Eq. (4) for the selected profile.
12: Calculate the battery degradation with this profile considering the previous degradation.
13: Calculate the degradation cost from V2G using Eq. (5) ► battery_deg_costv2g.
14: for Number of days do.
15: calculate the battery degradation without V2G
16: Calculate the battery degradation cost using Eq. (5). ►battery_deg_costnv2g.
17: calculate the total profit as per the Eq. (3)
Results
We start the simulation assuming the specification of an EV similar to the 2016 Nissan leaf (24 kWh) model, which is one of the most popular EV (3rd in 2019 worldwide). The simulation is run to represent 365 days with the price signal from the German day ahead electricity market for 2019. The parameters used for the execution of the model are shown in Table 4.
From the results, presented in Table 5, it is observable that the profit considering the battery degradation is higher than without considering the battery degradation. This observation is anomalous and the reason behind this lies in the type of battery considered. LMO is highly sensitive to high temperature and SOC (Thompson, 2018). Storing energy at high temperatures and at high SOC will cause.
more degradation than discharging the battery to a lower SOC and maintaining this lower SOC. Participating in V2G energy arbitrage maintains the battery SOC at a lower value and hence reduces battery degradation.
It is thus important to perform a sensitivity analysis to understand how generic the model is and to consider more type of vehicles. In fact, an EV is defined by various specifications like capacity, efficiency, and energy consumption. There are plenty of EV manufacturers in the market with different battery specifications. It is necessary to consider these factors and analyze their contribution to determine the sensitivity of V2G profit. We perform a sensitivity analysis with respect to the capacity, battery efficiency, and driving distance. The qualitative (scatter plot) Random Sampling Method is used for the sensitivity analysis (Hamby, 1994). 216 combinations of input parameters: capacity, efficiency, and driving distance are selected, and the corresponding profit is calculated using the profit model. The plot of the output against the input parameters shows the parameter sensitivity. The capacity is varied from 16 kWh to 100 kWh and the efficiency is varied by 85% up to 100% and the driving distance in terms of DOD is varied by 5% up to 30%. Figure 5 shows the variation of profit. Considering the use case of DOD = 0.05, efficiency = 1, and battery capacity = 100 kWh and with battery degradation, a profit of 723.93 €/EV/year is estimated. The total energy transferred in this case is 30,665 kWh/year at 23.60 €/MWh. Achieving 100% efficiency is practically not possible. A more realistic case would be with driving DOD = 0.05, efficiency = 0.95, and battery capacity = 100 kWh, yielding a profit of 662.37 €/EV/year. The minimum profit case would be with driving DOD = 0.3, efficiency = 0.85, and battery capacity = 16 kWh. The estimated profit in this case is 113.00 €/EV/year and the energy transferred is 2314.47 kWh/year.

Variation of profit with respect to RTE, battery capacity and driving distance
A sensitivity analysis shows that, lower driving distance, higher efficiency, and higher capacity values result in higher profit to the EV owner. For every 1 % increase in the round trip efficiency, there is an increase of 1.62 Euros in profit. For every 1 kWh increase in battery capacity, the profit increases by 1.85 Euros. For every 1 km decrease in driving distance per trip, profit increases by 6.64 Euros. Fig. 6 summarizes the sensitivity of energy transferred per year with respect to the above parameters. For more details on the sensitivity analysis we refer to (Malya, 2020).

Variation of total energy transferred with respect to RTE, battery capacity and driving distance
We are now in a position to provide a first comparison with the state of the art. The comparison should be taken with a grain of salt as there is no direct comparison between the results, as the price signals, the EV specification and the considerations are different in each estimation. Nevertheless, it is useful to attempt a general comparison, as presented in Table 6. The values of the state of the art and of the present study show that V2G energy arbitrage is profitable.
Along with V2G energy arbitrage, the EV can also participate in V2G ancillary services in the German energy market. Though, V2G ancillary services are not the main focus of this paper, we report only the main results and refer to (Malya, 2020) for the details. The primary frequency regulation ancillary services fetch a profit of − 2.05 € to 2.66 € for 184 days in 2019. Participating in secondary frequency regulation ancillary services yields a profit of 530.74 € to 534.02 € for the year 2019 and tertiary frequency regulation ancillary services generates a profit of 1373.02 € to 1376.30 € for the year 2019. The ancillary services result in more profit compared to V2G energy arbitrage because of the higher remuneration scheme.
Conclusions
The present study shows how the profit estimation for V2G energy arbitrage can be evaluated by considering the battery degradation cost and EV driving patterns.
Summary
The approach we proposed includes a dynamic battery degradation model to estimate battery degradation costs due to the V2G energy arbitrage. We consider the case where the EV owner controls the buying and selling of energy based on the German day-ahead market’s electricity price signal for the year 2019. The profit value for this case is significant, possibly indicating that the EV owner would be interested in participating in V2G energy arbitrage. In other terms, the answer to our original question “would an EV owner allow the use of his or her battery by the grid operator” is positive.
The profit earned does not only come from selling electricity to the grid but also from the savings from reduced battery degradation costs. With the LMO battery considered in this model, V2G energy arbitrage can improve the lifetime of the EV battery. However, this observation cannot be generalized for all battery types as the amount of degradation depends significantly on the chemical and physical characteristics of the battery. The sensitivity analysis results show that the profit increases with the capacity of the battery, the round trip efficiency, as well as with the decrease of the driving distance per day.
The profitability of the V2G energy arbitrage from EV owners’ perspective depends on factors like remuneration, battery degradation, battery specification, EV driving patterns and charging or discharging criteria. The profit evaluated changes as one of these factors changes. Without considering these factors, it is not possible to state if V2G energy arbitrage is profitable or not in general. Considering the German electricity price signals for the year 2019 and an EV with battery type LMO, this work evaluates that providing a price-based energy arbitrage is profitable for the EV owners.
Limitations
The economic models proposed in this article are general and can be used, in principle, for any market. On the other hand, the battery model is based on the LMO battery type. The profit model can be extended to battery degradation models of other battery types by translating the input and output parameters of the new battery degradation model to our profit model.
In the simulations, we have used fixed temperatures for the driving and parking state of vehicles. These temperatures are in line with the degradation model, but clearly do not represent all possible environmental conditions, especially extremely cold weathers.
The simulation results are based on a specific market, namely the German one. We expect the results to extend to energy markets with similar structures and prices to the German one, such as other European Union countries, Australia and New Zealand, and Japan, but this should be verified.
Future work
To overcome the limitations of the present study, it is important to consider other energy markets in addition to the German one. Particularly interesting might be markets with very different structures and pricing for energy such as the Middle East or former Soviet Union countries.
The model we proposed is purely an economic one. Since we are interested in incentives for the general public, one should also consider psychological and cultural factors. In other terms, the motivation of people to participate might be driven more strongly by social and sustainability incentives rather than purely economic ones. This should be verified with actual user studies which we leave open for future research.
Availability of data and materials
An extended treatment of the subject with details of the models and data used is the master thesis of the first author.
Abbreviations
- C-rate:
-
Charging rate
- DOD:
-
Depth of Discharge
- DSO:
-
Distributed System Operator
- EOL:
-
End of Life
- EV:
-
Electric Vehicles
- ISO-NE:
-
Independent System Operator New England
- kWh:
-
Kilo Watt hour
- LMO:
-
Lithium Manganese Oxide
- NCA:
-
Nickel Cobalt Aluminum oxide
- NYISO:
-
New York Independent System Operator
- PJM:
-
Pennsylvania, Jersey, Maryland Power Pool
- RES:
-
Renewable Energy Sources
- RTE:
-
Round Trip Efficiency
- SOC:
-
State of Charge
- V2G:
-
Vehicle-to-Grid
References
Almehizia AA, Snodgrass J (2018) Investigation of V2G economical viability. In: 2018 IEEE Texas Power and Energy Conference (TPEC). IEEE, pp 1–6
Barter P (2013) Cars are parked 95% of the time. Let’s check
Curry C (2017) Lithium-ion battery costs and market. Bloomberg New Energy Finance, p 5
Fernández I, Calvillo C, Sánchez-Miralles A, Boal J (2013) Capacity fade and aging models for electric batteries and optimal charging strategy for electric vehicles. Energy 60:35–43. https://doi.org/10.1016/j.energy.2013.07.068
German Federal Ministry for Economic Affairs and Energy (BMWi). Unsere Energiewende: sicher, sauber, bezahlbar; 2019a. (accessed on 02.01.20). Available from: https://www.bmwi.de/Redaktion/EN/Dossier/energy-transition.html
German Federal Ministry for Economic Affairs and Energy (BMWi). Electricity Market of the Future; 2019b. (accessed on 02.01.20). Available from: https://www.bmwi.de/Redaktion/EN/Dossier/electricity-market-of-the-future.html
Hamby DM (1994) A review of techniques for parameter sensitivity analysis of environmental models. Environ Monit Assess 32(2):135–154. https://doi.org/10.1007/BF00547132
Iclodean C, Varga B, Burnete N, Cimerdean D, Jurchis B (2017) Comparison of Different Battery Types for Electric Vehicles. In: IOP conference series: materials science and engineering. vol. 252. IOP Publishing, p 012058
IEA. Global EV Outlook 2019; 2019. (accessed on 30.12.19). Available from: https://www.iea.org/reports/global-ev-outlook-2019
Kamboj S, Kempton W, Decker KS (2011) Deploying power grid-integrated electric vehicles as a multi-agent system. In: The 10th International Conference on Autonomous Agents and Multiagent Systems-Volume 1, pp 13–20
Kester J, Noel L, de Rubens GZ, Sovacool BK (2018) Promoting vehicle to grid (V2G) in the Nordic region: expert advice on policy mechanisms for accelerated diffusion. Energy Policy 116:422–432. https://doi.org/10.1016/j.enpol.2018.02.024
Kiaee M, Cruden A, Sharkh S (2015) Estimation of cost savings from participation of electric vehicles in vehicle to grid (V2G) schemes. J Modern Power Syst Clean Energy 3(2):249–258. https://doi.org/10.1007/s40565-015-0130-2
Latini L, Armani FB, Leva S, Di Ninno F, Ravina G (2019) Economics of Vehicle-to-Grid application for providing ancillary services in Italy. In: 2019 IEEE Milan PowerTech. IEEE, pp 1–6
Madawala UK, Thrimawithana DJ (2011) A bidirectional inductive power interface for electric vehicles in V2G systems. IEEE Trans Ind Electron 58(10):4789–4796. https://doi.org/10.1109/TIE.2011.2114312
Malya PP (2020) Economic feasibility analysis of vehicle-to-grid service from an EV owner’s perspective in the german electricity market. IAAS University of Stuttgart
Mwasilu F, Justo JJ, Kim EK, Do TD, Jung JW (2014) Electric vehicles and smart grid interaction: a review on vehicle to grid and renewable energy sources integration. Renew Sust Energ Rev 34:501–516. https://doi.org/10.1016/j.rser.2014.03.031
Peterson SB, Whitacre J, Apt J (2010) The economics of using plug-in hybrid electric vehicle battery packs for grid storage. J Power Sources 195(8):2377–2384. https://doi.org/10.1016/j.jpowsour.2009.09.070
Raineri R, Rios S, Schiele D (2006) Technical and economic aspects of ancillary services markets in the electric power industry: an international comparison. Energy Policy 34(13):1540–1555. https://doi.org/10.1016/j.enpol.2004.11.015
Thompson AW (2018) Economic implications of lithium ion battery degradation for vehicle-to-grid (V2X) services. J Power Sources 396:691–709. https://doi.org/10.1016/j.jpowsour.2018.06.053
Uddin K, Jackson T, Widanage WD, Chouchelamane G, Jennings PA, Marco J (2017) On the possibility of extending the lifetime of lithium-ion batteries through optimal V2G facilitated by an integrated vehicle and smart-grid system. Energy. 133:710–722. https://doi.org/10.1016/j.energy.2017.04.116
Xu B, Oudalov A, Ulbig A, Andersson G, Kirschen DS (2016) Modeling of lithium-ion battery degradation for cell life assessment. IEEE Transact Smart Grid 9(2):1131–1140
Zhaoxi L, Qiuwei W, Christensen L, Rautiainen A, Yusheng X (2015) Driving pattern analysis of Nordic region based on National Travel Surveys for electric vehicle integration. J Modern Power Syst Clean Energy 3(2):180–189
Acknowledgements
Not applicable.
About this supplement
This article has been published as part of Energy Informatics Volume 4, Supplement 2 2021: Proceedings of the Energy Informatics.Academy Conference Asia 2021. The full contents of the supplement are available at https://energyinformatics.springeropen.com/articles/supplements/volume-4-supplement-2.
Funding
The research is partially funded by the Netherlands Organization for Scientific Research (NWO) under the MERGE (647.002.006) and NextGenSmart DC (629.002.102) projects.
Author information
Authors and Affiliations
Contributions
The work is based on the Master thesis of PM that was carried out under the supervision of MA who formulated the research problem. LF contributed to the energy models and MR to the power system aspects. The paper was mainly written by PM and edited by all authors. All authors read and approved the final manuscript.
Corresponding author
Ethics declarations
Ethics approval and consent to participate
Not applicable.
Consent for publication
Not applicable.
Competing interests
The authors declare that they have no competing interests.
Additional information
Publisher’s Note
Springer Nature remains neutral with regard to jurisdictional claims in published maps and institutional affiliations.
Rights and permissions
Open Access This article is licensed under a Creative Commons Attribution 4.0 International License, which permits use, sharing, adaptation, distribution and reproduction in any medium or format, as long as you give appropriate credit to the original author(s) and the source, provide a link to the Creative Commons licence, and indicate if changes were made. The images or other third party material in this article are included in the article's Creative Commons licence, unless indicated otherwise in a credit line to the material. If material is not included in the article's Creative Commons licence and your intended use is not permitted by statutory regulation or exceeds the permitted use, you will need to obtain permission directly from the copyright holder. To view a copy of this licence, visit http://creativecommons.org/licenses/by/4.0/.
About this article

Cite this article
Malya, P.P., Fiorini, L., Rouhani, M. et al. Electric vehicles as distribution grid batteries: a reality check. Energy Inform 4 (Suppl 2), 29 (2021). https://doi.org/10.1186/s42162-021-00159-3
Published:
DOI: https://doi.org/10.1186/s42162-021-00159-3