- Research
- Open access
- Published:
Distributed ledger technology for fully automated congestion management
Energy Informatics volume 1, Article number: 22 (2018)
Abstract
Congestion management in distribution grids is an important task for distribution grid operators, both from a financial and a technological perspective. Whereas large generation units and large controllable loads might in general be controllable in a manual way, this is no option for small distributed generators and loads. With flexibility control in multiple owner scenarios, documentation, transparency and automation are of crucial importance. In this work, we present a fully automated congestion management approach based on a combination of distributed ledger technology and distributed algorithms in an agent-based architectural approach. We present a case study focused on the visualization of the concept and discuss the advantages and possible challenges for this approach. Whereas distributed ledger technology has been introduced for peer-to-peer energy trading within the last years, no similar approach has been presented yet for stable distribution grid management.
Introduction
Distributed and renewable or highly efficient energy resources (DER) such as wind energy converters, photovoltaics, combined-heat and power plants as well as battery storage systems are important building blocks for the transition of the global energy system. DER have seen a significant rise in the share of the electric power generation of Germany, Austria and Switzerland over the last decades, thus helping both to reduce green house gas emissions and to substitute nuclear power plants. While hydropower plants are an important renewable energy resource especially in Austria and Switzerland (Eidgenössisches Departement für Umwelt 2018; Haas et al. 2018), many DER are or will be integrated at medium or low voltage levels. Thus, the increasing share of DER in the power system are a major challenge especially regarding the reliable operation of distribution grids. Traditionally, distribution grids were designed for peak loads, and not for DER peak generation. This may lead to several congestion problems, i. e. voltage band violations and thermal stress on power lines and transformers. A pragmatical, but from a macroeconomic point of view rather unsatisfying and inefficient solution to distribution grid congestions are feed-in management of DER (German: Einspeisemanagement, short: EISMAN) and power grid extensions.
As the costs of building new lines and transformers or reinforcing existing grid assets until 2032 may sum up to 20 - 50 billion Euro (E-Bridge et al. 2018), the German Association of Power and Water Economy (German: Bundesverband der Energie- und Wasserwirtschaft, BDEW) has proposed the usage of distributed flexibility for power grid operations. The so-called traffic light concept (German: Ampelkonzept) proposes three distinct phases that are tightly coupled to the operational state of a power grid (BDEW Bundesverband der Energie- und Wasserwirtschaft e. V. 2017). In the green phase, the operational state is feasible within the limits defined by (DIN 2010), and all DER may feed-in without restrictions. In contrast, in the red phase the operational state is critical, and the distribution grid operator (DSO) limits or totally shuts down the feed-in from DER as necessary in order to reach a feasible operational state. The third, yellow phase is a novel concept for the transition between normal operation (green phase) and congestion management measures (red phase). Here, flexible units such as battery storages, electric vehicles or other controllable loads may be economically incentivized by the DSO to change their consumption or feed-in. However, the traffic light concept does not propose a specific implementation of the yellow phase, and the first pilot projects evaluating different approaches such as a centralized flexibility platform (Innogy SE 2018) or cellular concepts (Smart Grids-Plattform Baden-Württemberg e.V 2018) have just recently finished. These approaches come with several drawbacks: First, they may require an elaborate, highly scalable and very reliable centralized communication and service platform. Second, individual contracts with owners and/or operators of DER may have to be signed, thus limiting the acquisition of flexibility to larger DER such as biogas plants. Third, an additional information processing system is needed in order to transparently track the provision of flexibility for reimbursement purposes.
In this paper, we therefore propose a fully automated congestion management system for distribution grid operation based on distributed ledger technology and intelligent agents by presenting a case study for an exemplary simplified scenario. We combine an off-chain negotiation process with an on-chain documentation of the contracted negotiation results to reduce mining overhead and storage requirements.
The rest of this paper is structured as follows: First, we give an overview on the problem of congestion management in distribution grids (“Congestion management in distribution grids” section). After that we introduce the methodological background of the chosen approach, namely agent-based flexibility control (“Agent-based flexibility control” section) and distributed ledger technology (“Distributed ledger technology” section). In “Case study: fully automated distribution grid congestion management” section, the case study is presented in detail, including a presentation of the chosen process for congestion management, the design decisions and the results of the case study in terms of the visualization of the implemented concept. We conclude with a discussion on the usefulness of the chosen concept and open question including future work.
Congestion management in distribution grids
In the northwestern part of Germany, large amounts of renewable energy resources, especially wind power plants, are already integrated into the power grid. Therefore, grid congestions are a rather typical situation, and feed-in management measures are increasingly necessary to maintain the distribution grids stability. Figure 1 shows the progression of feed-in management incidents in the grid area of the German DSO EWE from 2009 to 2016 including data for Q1 and Q2 2017.

Number of feed-in management incidents in the distribution grid area of EWE (2017: data for Q1 and Q2 only). Source: EWE AG
According to the German grid regulation authority (Bundesnetzagentur, short: BNetzA), feed-in management is a “specially regulated grid safety measure to relieve grid bottlenecks” (Bundesnetzagentur für Elektrizität 2014). Regarding renewable energy resources, the BNetzA specifies that “in accordance with the special prerequisites and legal consequences of feed-in management, the responsible grid operator can also temporarily regulate the feed-in from renewable energy […] if the grid capacities are not sufficient to transport the total electricity generated” (Bundesnetzagentur für Elektrizität 2014). Using feed-in management to regulate feed-in from renewable energy entails monetary compensation: “If renewable energy […] is regulated by feed-in management, the plant operator has a claim to compensation from its grid operator.” (Bundesnetzagentur für Elektrizität 2014)
Whereas feed-in management can be regarded as a reactively used “ultima ratio” in the sense of the red phase of the grid traffic light concept, proactively using the flexibility of controllable loads (also known as demand response) and flexible DER can be a feasible option for congestion management. In order to implement an intelligent use of flexibility, however, two major obstacles have to be overcome: First, grid operation has to be proactive both regarding the forecasting of loads and renewable energy production, and regarding the usage of power flow calculations and state estimation for the prediction of congestions. Second, the activation of flexibility, the documentation of its actual provision and the monetary compensation have to be flexible, scalable and highly automated in order to tap this potential in a feasible, economically and organizationally efficient way. The first topic has been in the focus of several national and international research projects within the last years, whereas the second topic has not been fully addressed yet. In the following sections, intelligent agents and distributed ledgers are introduced as a potential means to solve the second problem.
Agent-based flexibility control
Software agents constitute autonomous software programs that can both sense and influence their environment. A set of (interacting) agents constitutes a multi-agent system (Wooldridge 2009). At the level of single agents, multi-agent systems (MAS) differ especially regarding their internal representation of knowledge the agents gain from their environment, the MAS architecture and the level of autonomy of the individual agents. Multi-agent systems allow for distributed problem solving as a technological realization of distributed algorithms especially in those fields, where the structure of the problem to be solved inhibits complete (i. e. optimal) approaches for reasons of complexity and/or time requirements. For these tasks, MAS can be used to implement heuristic approaches.
In the context of agent-based control in Smart Grids, a huge body of research emerged for both economic and technological optimization goals. First results have been published in the field of demand side management and market-based concepts (Kok et al. 2005). For economic virtual power plant control several concepts have been presented with hierarchical and fully distributed concepts (Anders et al. 2013; Nieße and Sonnenschein 2015). Demand-side management has been setup in research projects using agent-based concepts with high degrees of autonomy (Pournaras et al. 2014). In the last years, more concepts have been presented in the context of stable grid operation, like voltage stabilization (Elmitwally et al. 2015; Vaccaro et al. 2015), frequency control (Lehnhoff et al. 2011), and other Smart Grid applications (see (Vrba et al. 2014) for an overview on further agent-based Smart Grid applications).
All of the referenced approaches are usually evaluated using a scientific excerpt of a larger system view, and thus reducing the real-world problem to be solved e. g. regarding the attached processes or involved actors: Feasibility and algorithmic performance is usually the main focus of the presented work, thus showing that agent-based control schemes can be used to solve the specific tasks.
To analyze the applicability and economic viability of such an approach though, full process consideration is needed. Especially the process of accounting and billing is often neglected when new or adapted algorithms are presented. As an effect, the restricted actor and process view might lead to problems when presenting the concepts to possible application partners in the industry.
Distributed ledger technology
Distributed Ledger Technology (DLT) has gained a lot of interest recently. Going back to Satoshi Nakamotos Blockchain implementation Bitcoin (Nakamoto 2009), DLT combines peer-to-peer networks, cryptography and game theory to provide a distributed and immutable transaction storage. Bitcoin was designed as a currency system in which signed transactions are stored by combining a number of transactions in a so-called block. The transactions are stored in structure called merkle tree (Merkle 1987) that supports the integrity of the contained data and provides an efficient way to check the validity of the contained data. Each block is secured using an additional hash function that is created for the data of the block header, which includes the root of the merkle tree, and must fulfill certain characteristics. Each block header has a reference to the hash value of the previous block. This ensures both the chronological order and the data integrity of the entire database. So-called miners are searching for the hash value of a new block. This search is associated with the provision of a certain amount of resources, at least in permissionless environments. Once found, the users agree whether the transactions and the block hash and therefore the blocks are valid or not (the so-called consensus). If the block is valid it is attached to the chain and the successful miner receives a reward. This list of chained blocks is public and can be verified by all peers. With this concept, blockchains solve the problem of distributed consensus (described e.g. in Lamport (1998)).
Relating to this principle, the blockchain technology has extended its use cases by integrating fully programmable functions, using graph-like structures instead of a single chain, or providing possibilities for access control (permissioned blockchains). This leads to the definition of DLT as a data register that establishes a verifiable consensus on the correctness of transactions and data in a decentralized peer-to-peer network, based on the calculation of hash values. This way, the DLT developed from being solely a technology for digital currencies, but can be used to store any kind of information, including executable computer code as smart contracts that are executed once certain defined conditions apply.
The heavily regulated energy sector is considered one of the key industries that will benefit from the distributed ledger technology. One of the first energy industry use case implemented was the local peer-to-peer trading of self-generated electricity from renewable energy sources in neighborhoods (microgrids). As so-called prosumers, the owners of solar systems are enabled to either consume their generated electricity themselves, sell it to their neighbors, or they can purchase electricity from other producers if the electricity generated by their own electricity supply is insufficient. The transaction handling is automated and enforced using smart contracts. Examples for these use cases are the Brooklyn Microgrid in New York (Mengelkamp et al. 2018) or Conjoule in Germany (Conjoule GmbH 2018). The German TSO TenneT and the company sonnen GmbH are using networked battery storages that are installed in more than 6000 households (sonnen GmbH 2018). The purpose is to test to what extent emergency measures such as the shutdown of wind farms can be reduced in the event of bottlenecks in the transmission grid using the storage capacities of the distributed battery systems. The intelligent charging management adapts individually to the particular situation in the TenneT network. The distributed ledger technology offers the possibility to connect the distributed system and to store all transactions reproducible.
While the TenneT and sonnen GmbH project is solely focusing on battery storage systems, there has been no approach to handle all kind of flexibility options (load shifting, distributed storage, renewable energy sources, etc.) in a distribution grid. The concept presented in this work aims at the use flexibility options in a distribution grid to solve congestion issues in distribution grids. It combines agent technology and distributed ledger technology to have a fully automatic process from the identification of the congestion up to the settlement of the used flexibility.
Case study: fully automated distribution grid congestion management
To present the case study, we first will give details on the process that has been developed for a fully automated distribution grid management in “Process overview” section. After that, we present the system design by introducing the layered agent concept regarding chosen optimization heuristic, the blockchain technology and the incentivation scheme. In “Scenario setup” section we introduce the chosen setup regarding (controllable) loads and flexible generation units in a simplified congestion scenario.
“Agent-based schedule adaptation” and “Visualization” sections present the results of the case study, with the results of the agent based optimization first followed by the key artifact of the presented work, the graphical user interface of the presented application.
Process overview
The distributed, intelligent and fully automated congestion management we propose in this work comprises five interconnected process steps (cf. Fig. 2). We will present them briefly and give information on the technical realization in the upcoming sections.
-
1.
Prediction of congestions: Based on forecasts for both loads and feed-in from DER, a DSO uses power flow analysis for the prediction of congestions, e. g. transformer overloads, in a given distributed grid. This is typically done day-ahead after the day-ahead market has cleared.
Fig. 2 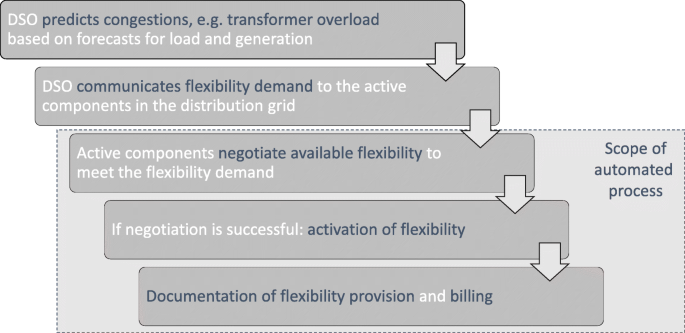
Overall process of automated distribution grid congestion management
-
2.
Communication of flexibility demand: In order to solve the congestion, the DSO derives a flexibility demand and a financial incentive and communicates it to the active components, e. g. controllable loads, DER and battery storage systems, in the affected distribution grid.
-
3.
Negotiation of available flexibility: Upon receiving a request for flexibility, the active components that are represented by intelligent agents in our system negotiate a response, i. e. the overall available flexibility they can provide for congestion management. Throughout this step, the agents can take into account the financial incentive given by the DSO, technical constraints of their respective active component and user preferences.
-
4.
Activation of flexibility: A successful negotiation results in the activation of the contracted flexibility. In this context, as the congestion itself is predicted for a future time interval, activation means that all active components change their schedules according to the flexibility they contributed during the negotiation.
-
5.
Documentation of flexibility provision and billing: In order to be able to verify the fulfillment of a contracted flexibility, an active component’s load and/or generation is continuously measured. Thus, the change in consumption and/or generation as promised in the updated schedules and the actual flexibility provision can be compared.

In this overall process, steps (1) and (2) are executed by the DSO. In Germany, research projects in the funding programs “SINTEG - Schaufenster Intelligente Energie” (Bundesministerium für Wirtschaft und Energie a) and “Zukunftsfähige Stromnetze” (Bundesministerium für Wirtschaft und Energie b) have put effort into the development of both improved state estimation methods and methods for the calculation of flexibility demand (Brüggemann et al. 2017; Frontier Economics Ltd 2017). In the following sections, we therefore focus on the system that implements steps (3) - (5) in a fully automated manner.
System design
To illustrate the combination of agent-based congestion management avoidance and a blockchain-based automated transaction system, several design decisions had to be taken. In the following we will briefly recap these. As an important note, these design decisions have not yet been analyzed regarding the optimization of the overall process, but should illustrate the potential of such an automated concept for congestion management to practitioners.
For the task at hand, we needed a system design that allowed for the simulation of the following aspects:
-
households comprising non-controllable or controllable loads and/or locally installed DER
-
optimization agents controlling the flexible loads (like EV charging) and generating units, being able to negotiate the adaptation of the flexible loads with other agents in the system
-
documentation agents realizing the documentation of both the flexibility offers and realization in a reliable way
To answer to these requirements, a three-level architecture has been set up (cf. Fig. 3): For each household, a simplified household simulation has been realized (lower layer for each component in Fig. 3). For this case study, a simple enumerated flexibility concept has been applied. Here, flexibility is the option to select a specific load profile—a schedule—from a set of different, feasible load profiles. This rather simple concept suffices for our case study, as we do not want to derive technical or economical performance indicators but demonstrate the feasibility of the overall concept. Of course, the flexibility model can and should be exchanged e.g. with sophisticated smart home models that can be integrated in sophisticated Smart Grid (co-)simulation frameworks.Footnote 1 The second and uppermost layer will be discussed in the following.

Overview on layered system architecture: Depending on a congestion warning (displayed as yellow traffic light), the agents cooperate using household simulation, cooperative agent layer and blockchain agent layer
Agent-based optimization heuristic The second layer represents the optimization agents. As has been discussed in “Agent-based flexibility control” section, many different concepts have been presented for agent-based control in smart grids. For the task at hand, a scheduling algorithm is needed to let the agents answer to a requested change in their forecasted demand or generation profile. Within the area of algorithms supporting these kind of tasks, competitive and cooperative concepts have to be distinguished: While competitive concepts usually rely on a large amount of participants to realize an optimized price effect, cooperative concepts can be applied within regulated boundaries and locally restricted areas that comprise a reduced amount of participants. As the proposed process (cf. “Process overview” section) should realize a yellow traffic light phase, it is not yet defined, if pure market-based concepts would be appropriate. Within the responsibility of one DSO, cooperative concepts might be more appropriate.
For this case study, we chose a light-weight implementation of COHDA (combinatorial optimization heuristic for distributed agents (Hinrichs and Sonnenschein 2016)). From an algorithmic point of view, COHDA is an algorithmic level parallel heuristic (see e.g. (Talbi 2009) for a characterization of distributed algorithms). As a full presentation of COHDA would be out of scope of this presentation, we focus on the relevant characteristics:
COHDA has been developed for the task of scheduling controllable distributed energy units that show different levels of flexibility. Flexibility is modeled using the concepts of operation schedules with typically 15 min. values. For each DER, a software agent is implemented that is able to (a) determine the flexibility potential of a specific unit, (b) negotiate a behavior change (i. e. a different choice of schedule from its flexibility potential). For the work at hand, we added the ability of controlling simulation models by coupling the COHDA agents with the simplified household simulation. In the presented case study, the process step of agent-based optimization is performed off-chain, i. e. without storing the intermediate negotiation results in the blockchain – as they are not yet part of a contract, there is no need for permanently storing them. Thus, storage and mining overhead is reduced compared to other approaches (cf. “Distributed ledger technology” section). The agents are coupled with the blockchain layer in such a way that the load prognosis, the optimized (negotiated) schedule and measurement data are made available for the contract agents as defined in the next paragraph.
Blockchain layer To realize the documentation layer, we decided to implement an Ethereum-based blockchain (Gavin Wood) for the following reasons: First, the underlying technology can be easily implemented for small studies by setting up private blockchains. Second and most important, Ethereum implements the concept of smart contracts: Smart contracts are a special form of contracts realized as software code. Once a contract has been confirmed in the blockchain, it is continuously checked if defined preconditions have become valid. If so, resulting actions will be taken automatically, without further approvement, as these are part of the contract themselves. To realize this concept, Ethereum realizes two types of accounts: Externally owned accounts (EOAs) represent the cryptocurrency part. Contract accounts (CA) are connected to a specific EOA and store the smart contracts. If preconditions in a smart contract get valid, this might have effect on the balance stored in the EOA.
Contract design: Smart contracts are basically class objects with functions and member fields, so it is up to the programmer to define preconditions and the resulting actions. We designed our smart contract in a way that allows to store all data of one participant for one day. This means, our contract contains three fields, each able to store a time series of 96 values. Each of these fields are accessible by write and read functions. The write function is modified to allow only one single write call on each field to prevent subsequent changes. There are also some control fields to check preconditions and internal functions for further calculations. The contract is currently hard-coded in the client software, which is sufficient for a case study. The client software also contains the interface to the smart contract functions. One to three types of time series are stored over time for each contract:
-
[b] First, each node starts its participation by deploying a copy of this contract filled with the initially predicted baseline schedule for the following day. This time series represents the prognosis for the components’ behavior.
-
[o] Next, in case of a change request initiated by the DSO, the agents start to negotiate. After this process has converged, the optimized schedule (i. e. the schedule that provides flexibility) is also stored in the specific contract.
-
[m] After execution of the schedule, the measured data is send to the contract as well. This last step also starts the calculation for the billing by comparing the measured data and the contracted schedule.
If an agent is not involved in a congestion prevention negotiation, only the first and last time series would be stored, thus resulting in the [bm]-state. For agents following the whole process, the contracts would take on the [bom]-state, storing forecasted values, negotiated schedules and measurement data.
The realization of an economic incentive is now directly realized using these contracts: When in [bom]-state, information on the forecasted, optimized and realized schedule is available in the blockchain. Using the concept of smart contracts, the billing is automatically started.
For the application of congestion management, a financial incentivation has to be realized to pay the participants for the offered and/or used flexibility. To illustrate this concept, we defined an exemplary currency called Enercoin. In the next paragraph, we briefly recap the incentivation scheme behind this currency.
Incentivation scheme To illustrate the economic aspects of distributed congestion management, a simplified incentivation scheme has been defined using an imaginary digital currency called Enercoins. This scheme should be understood as a first approach to realize the concept. Later studies can be performed to analyze a useful and economically feasible scheme.
In the following, we distinguish different flexibility behavior traits that can be shown by all participants of the congestion management process over time. They depend on internal and external factors, e. g. if flexibility has been offered and if it has been used to avoid congestion. The flexibility behavior traits can be summarized as follows:
-
FLEX_offer: The component is able to offer flexibility.
-
FLEX_requested: A flexibility offer been requested for the component.
-
FLEX_contract: The component has been contracted a specific schedule from its flexibility potential.
-
FLEX_follow: The component followed a contracted schedule.
The next behavior traits describe the effects if a component did not follow the contracted schedule. In these cases, the effect on the grid is reflected in the incentivation scheme, namely if a congestion has occurred as a possible effect of a schedule deviation, or if a schedule deviation reduced problems in the grid.Footnote 2 These effects are classified as deviation as follows:
-
DEV_grid-serving: The deviation from the contracted schedule improved the stability of the grid.
-
DEV_destabilizing: The deviation from the schedule lead to a more unstable situation.
-
DEV_congestion: A congestion occurred that could not be avoided by the activation of flexibility potential.
Following these behavioral traits, the incentivation scheme as depicted in Table 1 has been defined and implemented in the case study.
As an example, in type 1, the component offered flexibility (FLEX_offer), this flexibility has been requested and contracted, and later the component followed the contracted schedule. The component earned 30 Enercoins within this process. In type 2, the component offered flexibility, this has been requested, but was not needed and thus not contracted. The component was given 10 Enercoins for the offered flexibility and for following the forecasted behavior. In type 3, the component could offer flexibility, but this was not needed to compensate. The component then followed the forecasted behavior.
Type 4 reflects schedule deviations: The component showed a deviation of the contracted schedule, but the deviation has been grid-serving, i. e. less congestion has been the effect: The deviation compensated for other deviations in the grid. Type 5 is similar, with the component’s flexibility not being contracted in the process.
Type 6 and 7 reflect components that are either not involved in a negotiation (e.g. as not flexibility was needed) or components that are not able to offer flexibility.
Type 8 – 11 reflect instable grid situations that occurred despite the negotiation and contracting of flexibilities. Depending on the component’s behavior regarding the forecasted or contracted schedule, -4 to -9 Enercoins result for the participant,
Simulation environment The layered architecture as presented in Fig. 3 has been realized within a laboratory environment, with each component realized as a separate virtual machine. With this approach, full separation of the different components has been realized, thus alleviating the communication of the concept to be realized in the field as a both fully automated and distributed concept for distributed congestion management. The agent layer has been realized using the Python-based agent framework aiomasFootnote 3. For the blockchain realization, Ethereum has been used as already discussed in this section.
Scenario setup
For the case study, three types of households with different load profiles and varying flexibility have been modeled and integrated in a simplified exemplary grid (cf. Fig. 4). For each type of housefold a specific load profile was assumed which reflects the characteristics of the available facilities in each case. As we wanted to demonstrate the technical feasibility of our system in the sense of a proof-of-concept, we did not aim at creating perfectly realistic load profiles, but rather archetypical ones that allow the demonstration of the overall process and easy recognition of the different household types. In all load profiles, positive values refer to consumption, whereas negative values refer to generation of electric power. The first type of household consists of controllable loads only. Therefore, the default load profile specified by the BDEW (BDEW Bundesverband der Energie- und Wasserwirtschaft e. V. 2000) as depicted in Fig. 5 was taken as a basis to illustrate this kind of household.

Showcase grid scenario: Non-controllable loads (grey houses) and controllable generation and load components (with agent symbol in yellow) connected to a transformer

Exemplary schedule from the flexibility profile of a consumer-only household
In the second type of household feed-in from a photovoltaic plant is added to the load profile. In this case we assumed a sunny day for the simulation and therefore a high amount of feed-in of electrical power in the early afternoon. Figure 6 depicts this load profile, with the characteristic drop of the load curve far into the negative range where the feed-in from the photovoltaic system exceeds the local consumption.

Exemplary schedule from the flexibility profile of a household with photovoltaics
In addition to the photovoltaic plant, the third type of household has an additional energy storage system installed, which is assumed to be an electric vehicle. This energy storage can be used for load shaping, e. g. consuming produced solar energy or reducing the peak load. As an additional constraint, it is assumed to be necessary to charge the electric vehicle for the next day, so that there will be a peak in consumption during the evening. This behavior is shown in Fig. 7.

Exemplary schedule from the flexibility profile of a household with photovolatic and electric storage
As shown in Fig. 4, each of these types of household was deployed on two nodes in the scenario. Furthermore, every household needed a set of schedules representing the available flexibility that can be selected during the optimization process by the agents. Therefore, the basic load profiles in Figs. 5, 6 and 7 were subjected to Gaussian random noise in order to create a set of distinct schedules for each household. The non-controllable loads, also shown in Fig. 4, were represented by a variation of the default load profile.
All load profiles were aggregated in order to provide a global load prediction for the grid operator. This is depicted in Fig. 8. The total load and the proportion of the controllable households is shown. Additionally, the dotted line represents the feasible transformer peak power and indicates that a congestion was predicted, as the peak aggregated load surpassed this threshold. With this information, the optimization process was initiated with step (3) as defined in the overall process.

Predicted load with feasible transformer peak power. The darker area refer to non-controllable loads
Agent-based schedule adaptation
During the optimization process, each agent negotiated a new schedule for its household following the cooperative search as defined by the applied heuristic (cf. “System design” section). As an optimization goal, the avoidance of the congestion has been defined and communicated to the agents. In Fig. 9, the optimized load aggregated prognosis is depicted: In the relevant time intervals (70 - 85) the congestion has vanished from the prognosis as a result of new schedule choice of the involved agents.

Resulting load prognosis after agent-based adaptation of feed-in and demand. The forecasted overload has been largely reduced. The darker area represents non-controllable loads
In the chosen setup, this process has been configured for day-ahead planning, so different aspects might lead to new congestions during execution of the chosen schedules. caused by e. g. different weather conditions. To visualize this aspect in the case study, a random noise has been added to the optimized schedules. For an in-depth analysis of the economic feasibility of the concept, a detailed household simulation is needed (cf. “Conclusion and further work” section).
Visualization
In order to show the fully automated functionality of the distributed congestion management system and make it more accessible to practitioners from energy utilities and DSOs, we developed a visualization of key information in the system. The visualization, as shown in Fig. 10, is divided intro three sections:
-
Blockchain area: The upper area provides information about the current state of both the application and the blockchain. The left symbol indicates the current state of this node: Running means that this node is connected and synchronized with the blockchain. Next, the state of the contract agent is shown which is responsible for submitting contracts to the blockchain. It should be noted that this agent is not connected to the MAS, but is only responsible for communication with the blockchain in the client software. The block counter tracks the current number of blocks in the chain. Balance represents the amount of so-called Enercoins gained so far by the respective node.
Fig. 10 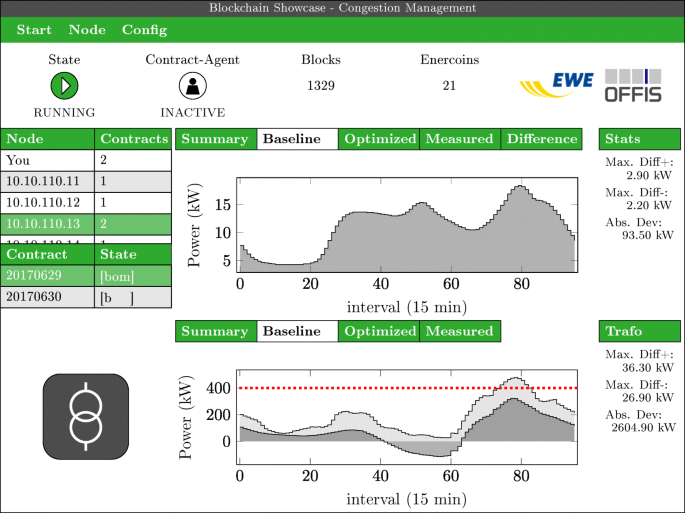
Graphical user interface of the application. The partner logos have been hidded for the reviewing process to ensure double-blindness
-
Participant area: The center area displays information accessible by each participant of the system. The tables on the left show all active nodes in the network, the number of contracts each one has published in the blockchain and all published contracts of the selected node. If a contract has been selected, the associated schedules are displayed in the center area. Different views are given for the baseline (i.e. the forecasted load / generation behavior), the optimized schedule after a negotiation and the measurement data. An additional view is integrated to depict the difference between contracted and measured behavior.
-
Aggregated transformer area: The lower area has been included for demonstration purposes. It represents the global view of the grid operator. The schedules of all nodes are aggregated. Additionally, uncontrollable loads are included in this view.

For the snapshot displayed in Fig. 10, we can see in the participant area that several nodes are involved in the current process. For the chosen participant, two contracts are listed. The first is in state [bom], whereas the second (for day 2017-06-30) is still in state [b]. From last runs, the participant earned 21 Enercoins as can be seen in the upper right corner in the blockchain area. For the contract 20170629 chosen for display (highlighted in the middle left contract table), the aggregated view on transformer level is displayed in the aggregated transformer area at the bottom of the visualization. The baseline is chosen for display in the aggregated view. It can be seen, that at about interval 75-82, a congestion is forecasted, as the aggregated load is not within the transformer’s boundaries. Figure 4 displays the results after optimization. If the view measured would be chosen in the aggregated transformer area, these results would be displayed.
As can be seen, the visualization combines results from both energy system related and blockchain (i. e. incentivation-related) aspects. The transformer view is not needed to set up the fully distributed system, but needed to illustrate the potential of the system. Thus, this aggregated and thus centralized aspect is not part of the algorithmic setup, but used for visualization only.
Conclusion and further work
In this work, we presented a fully automated congestion management system for distribution grid operation based on distributed ledger technology and intelligent agents. The intelligent agents are able to cooperate in order to negotiate schedule choices from their range of flexibility to avoid forecasted congestions on the transformer level. Contract agents were added to realize a fully distributed and automated documentation and billing process, thus closing the gap between control aspects and economic process fulfillment. To illustrate the concept, an simple incentivation scheme has been defined to show how different participant behavior can be used to incentive grid-serving behavior.
The focus of the work presented here has been on visualization and feasibility. Therefore, several simplifications have been chosen and discussed throughout the whole process. It can be seen though that with this case study, more detailed work on the definition of a fully distributed congestion management in the distribution grid can be performed. As an example, the simplified household model can be exchanged easily by adding a sophisticated smart home model.
Several open questions have been discussed while developing this case study and will now guide future work:
-
Incentivation scheme: Would the presented incentivation scheme lead to an active participation? Does it realize congestion management at low cost?
-
Flexibility assessment: What would be an appropriate method to assess the flexibility of the active participants?
-
Hardware implementation: What would be an appropriate hardware to implement the chosen approach in the field? This will be connected with the chosen flexibility assessment as they might define requirements regarding storage and CPU.
-
Scalability: While agent-based optimization concepts have been proven to fit large scale scenarios, this has to be evaluated for combined agent-optimization / blockchain systems. Depending on the use case, time requirements have to be taken into account.
-
Fraud mitigation: There are several steps in the process where fraud would be possible: participants could e. g. pretend a grid-critical behavior in the first step of delivering a prognosis (state [b]) to evoke a situation where they can earn money by solving these grid issues. On the other hand it has to be ensured that the measured data really reflect the contracted schedule. For some of these aspects, existing concepts from the smart metering domain have to be taken into account.
-
Choice of blockchain technology: In this case study, Ethereum has been used for ease of use and the feature of smart contracts. In a pilot implementation in the field, other DLT implementations have to be taken into account, e. g. HyperLedger might be an interesting alternative due to the permission concept. The choice will have to guided by scalability and time requirements.
-
Data management: We used the smart contracts and, therefore, the blockchain to store the time seres of the participant. This will most likely lead to a rapidly growing amount of data, which have to be stored at each participant. These aspects should be taken into account when choosing a suitable data management system.
As a general outcome of the work presented here, it can be concluded that the visualization has shown large benefits regarding the communication of both agent-based optimization and blockchain realization with practitioners from the distribution grid management domain. A pilot project will be defined where the open questions should be answered and a first implementation in the field will be realized.
Notes
Different Smart Grid (co-)simulation frameworks have been presented, e.g. GridLabD (https://www.gridlabd.org/), mosaik (http://mosaik.offis.de/), and OpSim (https://www.iee.fraunhofer.de/en/schnelleinstieg-wirtschaft/themen/opsim-homepage.html).
For this case study, we did not solve the problem of identifying the role of individual deviations regarding grid problems. This will be part of future work but is not needed to illustrate the concept as such.
https://aiomas.readthedocs.io, accessed 2018-08-14
Abbreviations
- CA:
-
Contract accounts
- COHDA:
-
Combinatorial optimization heuristic for distributed agents
- EOA:
-
Externally owned accounts
- EV:
-
Electric vehicle
- DER:
-
Distributed energy resource
- DLT:
-
Distributed ledger technology
- DSO:
-
Distribution grid operator
- MAS:
-
Multi-agent systems
- TSO:
-
Transmission system operator
References
Anders, G, Siefert F, Reif W (2013) A System of Systems Approach to the Evolutionary Transformation of Power Management Systems In: 43. Jahrestagung der Gesellschaft Für Informatik e.V. (GI), Informatik Angepasst an Mensch, Organisation und Umwelt.. Gesellschaft für Informatik, Köllen Druck+Verlag, Koblenz.
BDEW Bundesverband der Energie- und Wasserwirtschaft e. V. (2000) VDEW-Bericht “Lastprofilverfahren zur Belieferung und Abrechnung von Kleinkunden in Deutschland”. https://www.allgaeunetz.com/download/vdewm022000lastprofilverfahrenzurbelieferungun.pdf. Accessed 14 Aug 2018.
BDEW Bundesverband der Energie- und Wasserwirtschaft e. V. (2017) Konkretisierung des Ampelkonzepts im Verteilungsnetz (Diskussionspapier). https://www.bdew.de/media/documents/20170210_Konkretisierung-Ampelkonzept-Smart-Grids.pdf. Accessed 14 Aug 2018.
Brüggemann, A, Görner K, Rehtanz C (2017) Evaluation of Extended Kalman Filter and Particle Filter Approaches for Quasi-dynamic Distribution System State Estimation 2017(1):1755–1758.
Bundesnetzagentur für Elektrizität, Gas, Telekommunikation (2014) Leitfaden zum EEG-Einspeisemanagement. Abschaltrangfolge, Berechnung von Entschädigungszahlungen und Auswirkungen auf die Netzentgelte. Version 2.1 (Stand: 07.03.2014). https://tinyurl.com/y8aa7ny8. Accessed 14 Aug 2018.
Bundesministerium für Wirtschaft und EnergieFörderprogramm SINTEG: “Schaufenster Intelligente Energie - Digitale Agenda Für die Energiewende”. https://www.bmwi.de/Redaktion/DE/Artikel/Energie/sinteg.html. Accessed 14 Aug 2018.
Bundesministerium für Wirtschaft und EnergieSTROMNETZE - Forschungsinitiative der Bundesregierung. http://forschung-stromnetze.info/. Accessed 14 Aug 2018.
Conjoule GmbH (2018) What Happens When Clean Energy Goes Local? http://conjoule.de/en/home/. Accessed 14 Aug 2018.
E-Bridge, IAEW, OFFIS (2018) Moderne Verteilernetze Für Deutschland (Verteilernetzstudie). https://www.bmwi.de/Redaktion/DE/Publikationen/Studien/verteilernetzstudie.html. Accessed 14 Aug 2018.
Eidgenössisches Departement für Umwelt, Verkehr, Energie und Kommunikation UVEK im Bundesamt für Energie BFE (2018) Schweizerische Statistik der erneuerbaren Energien. Ausgabe 2017 (Vorabzug). http://www.bfe.admin.ch/themen/00526/00541/00543/index.html?lang=de&dossier_id=00772. Accessed 14 Aug 2018.
Elmitwally, A, Elsaid M, Elgamal M (2015) Novel multi-agent-based scheme for voltage control coordination in smart grids. J Energy Eng 141(3). https://doi.org/10.1061/(ASCE)EY.1943-7897.0000212.
Frontier Economics Ltd (2017) Beitrag von Flexibilitäten im Verteilnetz zur Senkung der Redispatchkosten in Deutschland. Studie im Auftrag von Innogy und deutschen Verteilnetzbetreibern (DSO 2.0). https://www.bdew.de/media/documents/20170809_Studie-Redispatchkosten.pdf. Accessed 14 Aug 2018.
Gavin WoodEthereum: a Secure Decentralised Generalised Transaction Ledger. http://gavwood.com/paper.pdf. Accessed 14 Aug 2018.
Haas, R, Resch G, Burgholzer B, et al (2018) Stromzukunft Österreich 2030 - Analyse der Erfordernisse und Konsequenzen eines ambitionierten Ausbaus erneuerbarer Energien (Endbericht). https://www.igwindkraft.at/mmedia/download/2017.07.10/1499698755049626.pdf. Accessed 14 Aug 2018.
Hinrichs, C, Sonnenschein M (2016) A distributed combinatorial optimisation heuristic for the scheduling of energy resources represented by self-interested agents. Int J Bio-Inspired Comput 8:69–78.
Innogy SE (2018) Proaktives Verteilnetz - Intelligente Stromnetze der Zukunft. https://iam.innogy.com/ueber-innogy/innogy-innovation-technik/smart-grids/proaktives-verteilnetz. Accessed 14 Aug 2018.
Kok, K, Warmer C, Kamphuis R, Mellstrand P, Gustavsson R (2005) Distributed Control in the Electricity Infrastructure In: Proceedings of the International Conference on Future Power Systems.. IEEE, Amsterdam.
Lamport, L (1998) The part-time parliament. ACM Trans Comput Syst 16(2):133–169. https://doi.org/10.1145/279227.279229.
Lehnhoff, S, Krause O, Rehtanz C, Wedde HF (2011) Distributed Autonomous Power Management. at - Automatisierungstechnik 3:167–179.
Mengelkamp, E, Gärttner J, Rock K, Kessler S, Orsini L, Weinhardt C (2018) Designing microgrid energy markets: A case study: The brooklyn microgrid. Appl Energy 210:870–880.
Merkle, RC (1987) A digital signature based on a conventional encryption function In: Conference on the Theory and Application of Cryptographic Techniques, 369–378.. Springer, London.
Nakamoto, S (2009) Bitcoin: A peer-to-peer electronic cash system. http://www.bitcoin.org/bitcoin.pdf. Accessed 11 Sept 2018.
Nieße, A, Sonnenschein M (2015) A Fully Distributed Continuous Planning Approach for Decentralized Energy Units In: 45. Jahrestagung der Gesellschaft Für Informatik e.V. (GI), Informatik, Energie und Umwelt.. Gesellschaft für Informatik, Köllen Druck+Verlag, Cottbus.
Pournaras, E, Vasirani M, Kooij RE, Aberer K (2014) Decentralized Planning of Energy Demand for the Management of Robustness and Discomfort. IEEE Trans Ind Inf 10(4):2280–2289. https://doi.org/10.1109/TII.2014.2332114.
Smart Grids-Plattform Baden-Württemberg e.V (2018) C/sells - Das Schaufenster Für Intelligente Energieversorgung. http://www.csells.net/de/. Accessed 14 Aug 2018.
sonnen GmbH (2018) Smart Local Grids with Blockchain - Sonnen Is Participating in the NEMoGrid Project. https://sonnenbatterie.de/en/smart-local-grids-blockchain-sonnen-participating-nemogrid-project. Accessed 14 Aug 2018.
Talbi, E-G (2009) Metaheuristics: From Design to Implementation. Wiley, Hoboken.
Vaccaro, A, Loia V, Formato G, Wall P, Terzija V (2015) A Self-Organizing Architecture for Decentralized Smart Microgrids Synchronization, Control, and Monitoring. IEEE Trans Ind Inform 11(1):289–298. https://doi.org/10.1109/TII.2014.2342876.
DIN (2010) EN 50160:2011-02, Voltage characteristics of electricity supplied by public distribution networks. (Deutsche Fassung DIN EN 50160:2010 + Cor).
Vrba, P, Mařík V, Siano P, Leitão P, Zhabelova G, Vyatkin V, Strasser T (2014) A Review of Agent and Service-Oriented Concepts Applied to Intelligent Energy Systems. IEEE Trans Ind Inform 10(3):1890–1903.
Wooldridge, M (2009) An Introduction to Multi-Agent Systems. Wiley, Hoboken.
Funding
Parts of the presented work have been funded by EWE AG, Oldenburg, Germany. Publication costs for this article were sponsored by the Smart Energy Showcases - Digital Agenda for the Energy Transition (SINTEG) programme.
Availability of data and materials
The software used within this work is based on publicly available open source software as indicated and referenced. Data have been provided by EWE AG and are available to the public in the presented granularity. Raw data are not available to the public.
About this Supplement
This article has been published as part of Energy Informatics Volume 1 Supplement 1, 2018: Proceedings of the 7th DACH+ Conference on Energy Informatics. The full contents of the supplement are available online at https://energyinformatics.springeropen.com/articles/supplements/volume-1-supplement-1.
Author information
Authors and Affiliations
Contributions
AN was involved in developing the system design, and implemented the multi agent system. NI was involved in developing the system design and the design of the blockchain layer. SB designed and implemented the blockchain layer and the visualization. MP analyzed the industry data, developed ideas for the visualization, and defined the incentivation scheme. MT was involved in developing the system design and defined the case study. SL was involved in developing the system design and the motivational background. All authors have read and approved the final manuscript.
Corresponding author
Ethics declarations
Competing interests
The authors declare that they have no competing interests.
Publisher’s Note
Springer Nature remains neutral with regard to jurisdictional claims in published maps and institutional affiliations.
Rights and permissions
Open Access This article is distributed under the terms of the Creative Commons Attribution 4.0 International License(http://creativecommons.org/licenses/by/4.0/), which permits unrestricted use, distribution, and reproduction in any medium, provided you give appropriate credit to the original author(s) and the source, provide a link to the Creative Commons license, and indicate if changes were made.
About this article

Cite this article
Nieße, A., Ihle, N., Balduin, S. et al. Distributed ledger technology for fully automated congestion management. Energy Inform 1 (Suppl 1), 22 (2018). https://doi.org/10.1186/s42162-018-0033-3
Published:
DOI: https://doi.org/10.1186/s42162-018-0033-3